|
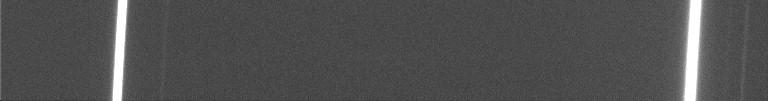
Level 0a
Two-dimensional spectrum (2-D),
representing the sum a series of individual preprocessed spectra. Preprocessing consists of
subtracting the offset (bias), and dark (thermal) signals and dividing by the
flat-field. Finally cosmetic corrections
are made (elimination of cosmic ray hits, for example). If the individual spectra are
offset by more than 4 pixels in the vertical direction compared to the
average position, the spectra are realigned in the vertical direction only (axis
perpendicular to the dispersal). The prefered file format is FITS. The width of the image (vertical
axis) should be at least 100 pixels for a satisfactory measurement of the sky
background.
|
|
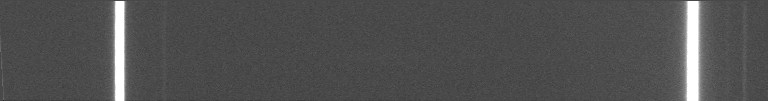
Level 0b
2-D Spectrum corrected for first
order geometric distortions: the dispersion axis is horizontal and the
spectral lines are vertical (“tilt” and "slant" type corrections). The sky background is subtracted by
interpolation using the area both sides of the spectrum of the object
observed. The prefered file
format is FITS.
|
|
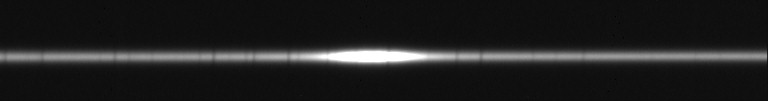
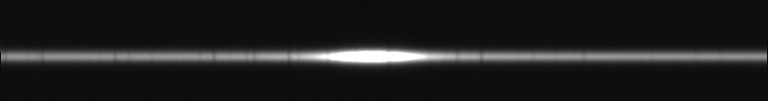
Level 0c

Spectral profile in the form of a
2-D image. The profile is
extracted from the level 0b product by binning, (addition) along the vertical
axis, the pixels which have received a significant signal from the object. The profile thus generated is
duplicated on 20 rows to produce a 2-D image and enhance the visibility of
the spectrum. The prefered file
format is FITS.
|
|
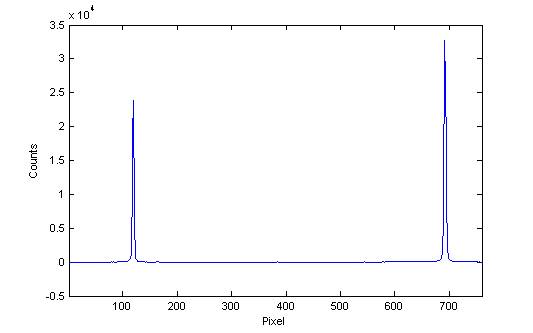
Level 1a
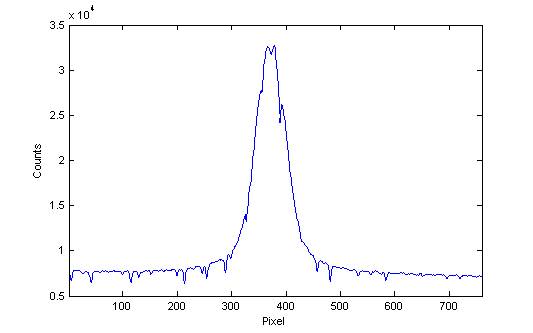
A 1-D profile representing one of
the rows of a level 0c product. The level 0c and 1a products are quite
similar. Only the format of the
data is different.
A
level 1a product is an ASCII file in two columns: Column 1 contains the pixel
numbers (the first pixel is always 0), column 2 contains the counts (ADU) for
the corresponding pixel.
|
|
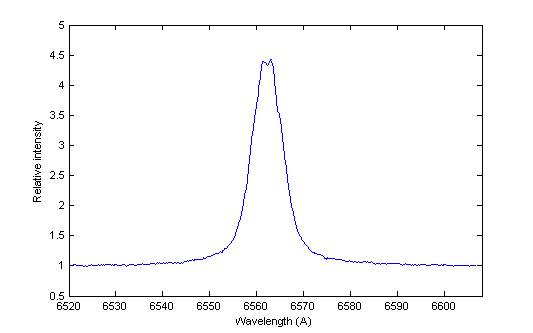
Level 1b
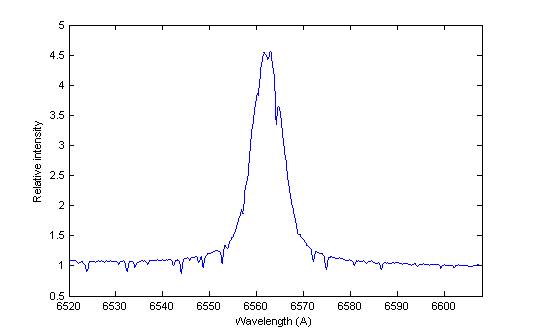
Spectral profile calibrated in wavelength. The dispersion law of a level 1b product
is linear. To achieve this, we
apply a second (or possibly third) degree polynomial wavelength linearization
function to the level 1a product. The RMS calibration residuals should be less than
0.05 Angstrom (for a 2400 lines / mm grating). Optionally, to facilitate the visualization, the
data can be normalized to unity in a uniform area of the continuum (eg around
6600 angstroms for a spectrum from a LHIRES equipped with a 2400
lines/mm grating).
This
operation is limited to the division of all points of the spectra by a
constant. The prefered file
format is 1-D FITS.
|
|
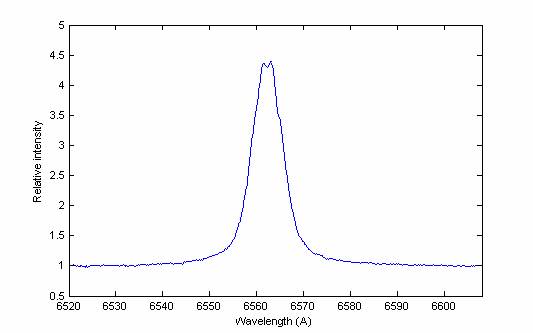
Level 1c
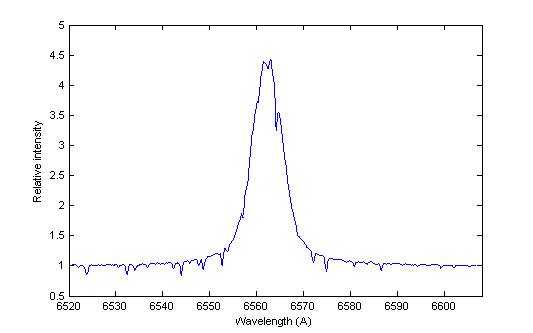
A level 1b
spectral profile divided by the instrumental spectral response curve. The prefered file format is 1-D
FITS. This is the level
required by the Be star spectrum database.
|
|
Level 2 - Level 2a
Telluric lines of water vapour removed. It is produced by dividing a 1c
level spectrum by the theoretical spectrum of water vapour. The H2O spectrum is filtered to
match the resolution of the stellar spectrum and adjusted in intensity
(absorbance). The level 1a spectrum
may be re-calibrated based on the set of atmospheric lines to improve the
accuracy of the spectral calibration. The prefered file format is 1-D FITS.
|
|
Level 2b
Level 2a spectrum divided
by the adjusted profile of the local continuum. Data level 2b are used,
for example, to calculate the line equivalent width.
|
|
Level 2c
A level 2b spectrum whose
spectral calibration has been corrected for the Doppler effect associated
with the movement of the Earth around the Sun and around its axis
(heliocentric correction).
|