Fringes pattern
in spectra
Page
written by B. Mauclaire
Page updated
2010-05-24
Abstract:
Many spectrograph users observed in their spectra fringe patterns. In low
resolution such a pattern looks like waves in star's continuum which can be
interpreted as small emission lines. In high resolution spectra the pattern
limits resolution for small detail analysis. These patterns are caused by the
{spectrograph-ccd camera} system since they are visible in flat-fields.
In order to know whether these patterns come from the spectrograph or from
the camera, and who is responsible of what, we gather several amateur
observations to study as many as possible {spectrograph-ccd} combinaisons. We
attempt at drawing preliminary conclusions.
Finally, we review techniques proposed by some amateurs that may help, in
somes cases, to remove fringes.
Flat-field obtained for several combinaison
{spectrograph-camera}:
1. Working with low resolution spectrographs (eg.
150 g/mm gratting):
Here are some flat-fields obtained with spectrographs up to R=2000.
Links to related pages:
2. Working with medium resolution spectrographs
(eg. 1200 g/mm gratting):
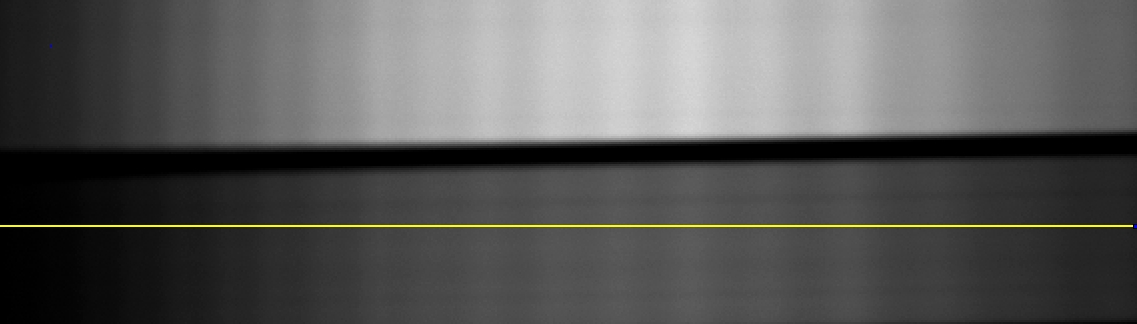
Here are some flat-fields obtained with spectrographs up to R=10000.
| Configuration description |
Flat-field picture |
KAF1603ME(ST8)+LHIRES3 1200 g/mm
P. Lailly |
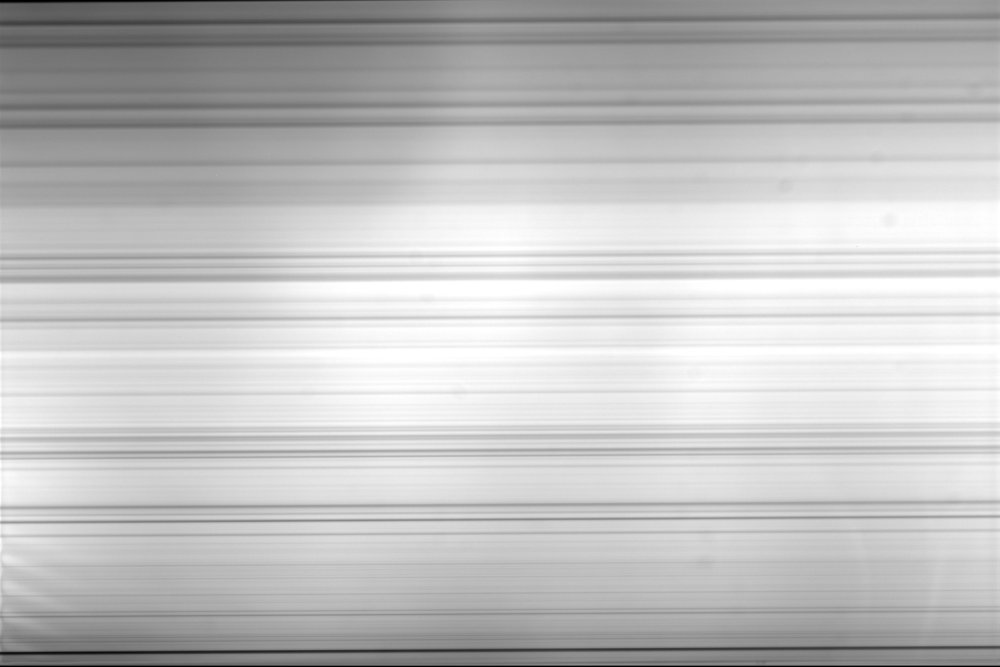 |
KAF1600(Audine)+LHIRES3 1200 g/mm
V. Desnoux |
 |
K640+LHIRES3 1200 g/mm
L. Schanne |
 |
Links to related pages:
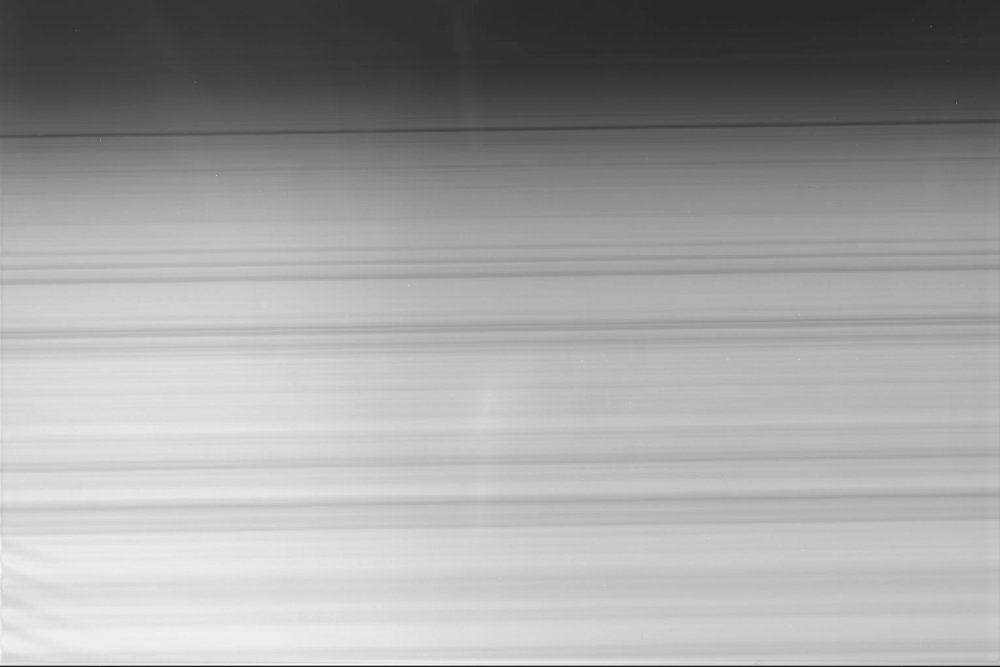
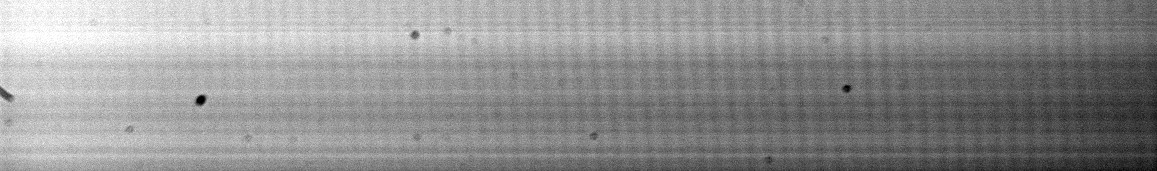
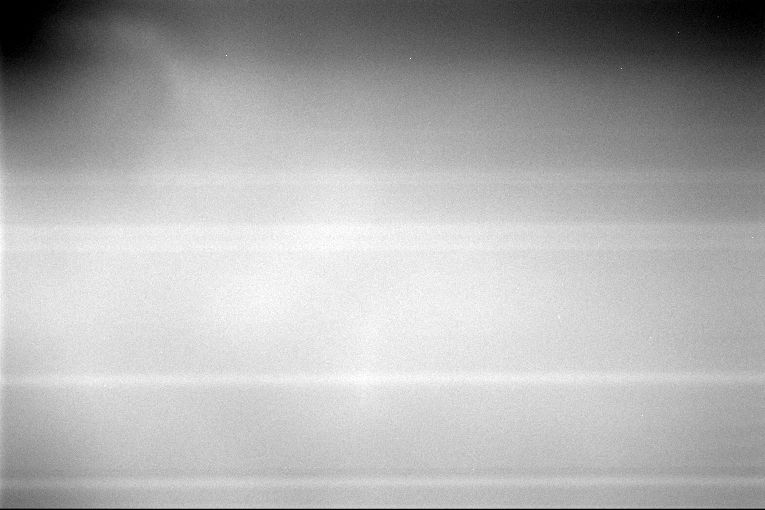
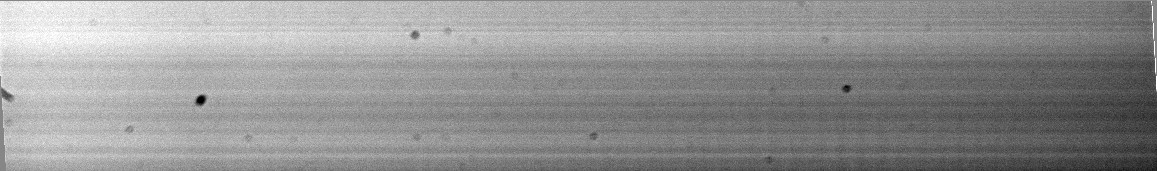
3. Working with high resolution spectrographs (eg.
2400 g/mm gratting):
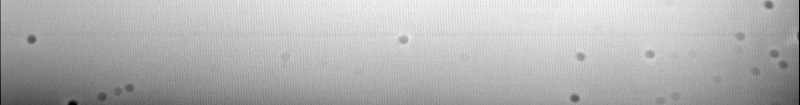
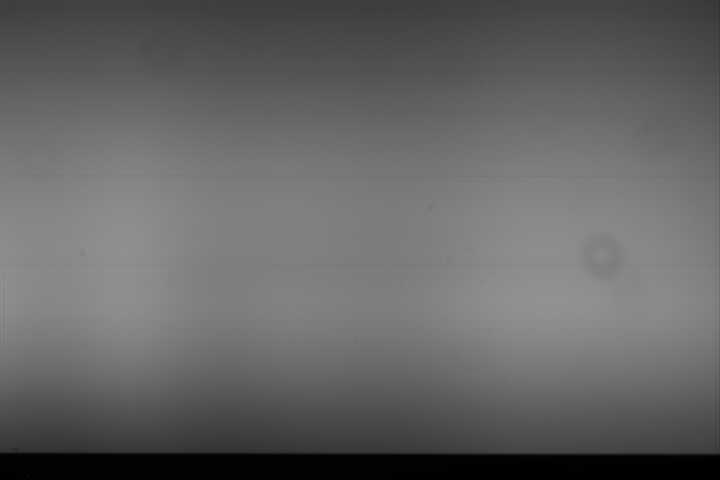
Here are some flat-fields obtained with spectrographs up to R=20000.
| Configuration description |
Flat-field picture |
KAF1603ME(ST8)+LHIRES3 2400 g/mm
P. Lailly |
 |
20D+LHIRES3 2400 g/mm
P. Schlatter |
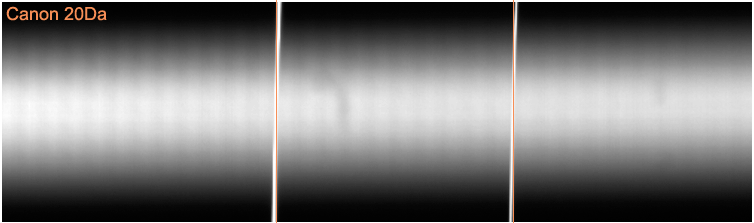 |
DSI2pro+LHIRES3 2400 g/mm
P. Schlatter |
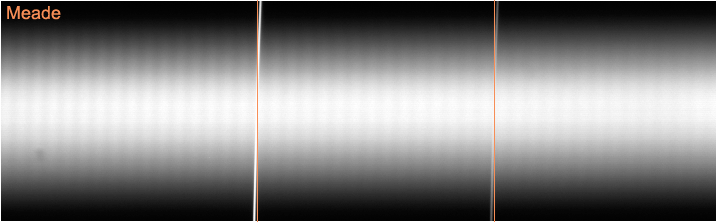 |
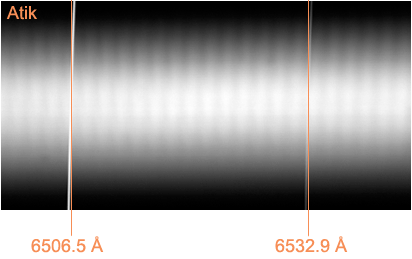
ATK1HS2+LHIRES3 2400 g/mm
P. Schlatter |
 |
Canon 350D+LHIRES3 2400 g/mm
C. Buil |
 |
KAF1603ME(ST8)+LHIRES3 2400g/mm
B. Mauclaire |
 |
Links to related pages:
4. More tests are required
We would be very grateful if spectrograph providers could help their
customers to understand what happens. We would like to make available a
methodic study involving:
- the test of many cameras with the same spectrograph;
- the test the same camera with many samples of the same spectrograph
model;
- the influence
of some tunings (mirror for instance);
- The study
could be carried out at high and low resolutions.
Possible explanations:
1. Pnenomena related to the camera:
Peter
Schlatter has carried out a thorough study about the relationship between
ccd sensor's protection glass and ripple's width. As this glass has parallel
faces, it seems to produce interferences at visible wavelengths and with
normal incidence light, with fringe patterns depending on the glass's
thickness and on the grating used in the spectrograph.
In the other hand, some people seem not to get such fringe patterns. This
could come from their ccd sensor's glass that may have a specific thickness.
So we now need to know every cover glass's thickness, especially for
Canon 350D and KAF400/1600 ccd sensor, in order to
confirm or not the above-mentioned relationship.
2. Phenomena related to spectrographs:
It has been shown that the tuning of LHIRES3's main mirror has an effect
on fringes' intensity.
Possible solutions:
1. Spectrograph's setup:
As C. Buil showed in OHP 2007, fringe patterns depend on LHIRES3's main
mirror setup and may desapear when neon lines are as close to vertical as
possible. But this has consequences: more important geometrics deformations
and perhaps less light concentrated on ccd.
J. Ribeiro tilted his main mirror and fringes appear with less stretch.
O. Thizy suggests to tilt a bit the grating position.
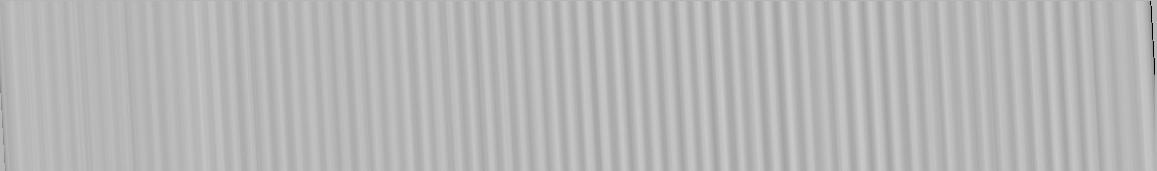
2. Software's solution:
C. Buil and V. Desnoux have described a method in OHP 2007's spectro star
party (bottom of the page) and OHP 2009 to deal
with ripple patterns by extracting the "high frequency" component of the
flat-field.
- Take a flat-field during the same night as you acquire other
spectra:
- Do a blur filter or Gaussian filter on flat-field in order to get only
the low frequency variations:
- Extract the high frequency intensity's variations by dividing the
original flat-field by the low frequency flat-field:
- Divide all spectra by the low frequency flat-field;
- Do a wavelength calibration of the high frequency flat-field in order
to determine the horizontal offset to apply on it;
- Divide all spectra by this new high frequency flat-field.
As B.
Mauclaire and V. Desnoux showed
in their tests, this method can be applied only if:
- A neon spectrum has to come with the flat-field;
- Flat-field must show that ripples' position
and pseudo-period do not vary with time (make tests during 20 mins for
example);
- Flat-field are taken the same night.
Conclusions:
Today the origin of fringe patterns in spectra is not clearly understood:
more tests are required.
Fringes pattern are visible in flat-field but also in stellar spectra. Note
that fringes have its pseudo-period and intensity growing toward spectrum's
blue side. So, dividing the sepctrum by such flat-field may sometime remove
fringes and sometime increase fringes' intensity.
There is no universal method to easily remove ripples in any material
setup.