by Peter Schlatter
Spectra of a continuum source taken at high resolution with a LHIRES III spectrograph [1] often show a wavy structure, the wave crests being more or less parallel to the slit with a wavelength of a few Ångströms. This behavior has been described by Christian Buil, see e.g. http://astrosurf.com/buil/spectro_apn2/test.htm and http://www.astrosurf.com/aras/ohp2007.htm.
So far, it wasn't clear if the effect is due to the spectrograph, the camera, or an interaction between them. This report shows that the ripples are caused by the protective glass plate (or filter, depending on the camera) covering the sensor chip. Therefore the effect is not restricted to the LHIRES spectrograph and may show up with any other type of spectrograph as long as its resolution is sufficiently high.
A halogen lamp serves as the source for producing a continuous spectrum (Fig. 1). The lamp is imaged onto the spectrograph slit with a telescope objective and a positive lens. In order to suppress the structure of the lamp filament, its image is slightly defocused with respect to the spectrograph slit. The positive lens has an f-number of f/10 which corresponds to the f-number of the spectrograph.
Fig. 1: Test setup for measuring the spectrum of a halogen lamp
This setup was chosen for convenience. It is part of my test bench for measuring filter curves (see Fig. 2, the filters are placed in the collimated beam between the two lenses). A much simpler setup without lenses may be used where the lamp illuminates a diffuser in place of the small lens. Measurements with both types of setup produced identical results.
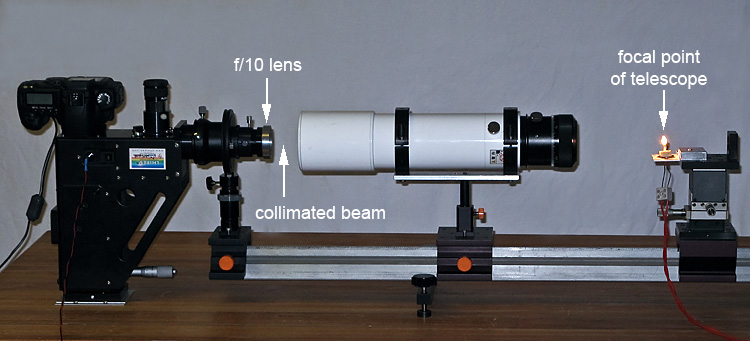
Fig. 2: Test setup
The following equipment was used:
Spectrograph
LHIRES III by Shelyak Instruments
Grating 2400 lpm
Slit width 25 µm
Cameras
| Make | Model | H pixel size (mu) |
V pixel size (mu) |
| Canon | 20Da |
6.4 |
6.4 |
| Meade | DSI II PRO |
8.6 |
8.3 |
| Atik | ATK-1HS II |
5.6 |
5.6 |
Spectra of the halogen lamp have been recorded with all three cameras. The Canon camera body was attached to the LHIRES by means of a T-ring (see Fig. 2) and the focus of the spectrograph was adjusted in this configuration. When changing to the Meade or Atik camera, the spectrograph has been left untouched. Focusing was established by moving the Meade or Atik camera in a 1.25 inch eyepiece holder which was screwed to the spectrograph in place of the T-ring. The three spectra shown in Fig. 3 - one spectrum for each camera - were taken within an hour at constant environmental conditions. Exchanging the camera body and taking Ne calibration spectra were the only manipulations between the recordings.
Fig. 3: Interference fringes in the continuous spectrum of a halogen lamp, two Ne calibration lines.
Fringes are clearly visible with all three cameras. The crucial point is that the distance between the wave crests, hereafter called the fringe period, varies from camera to camera. There is no correlation between pixel size and fringe period: the Canon and Atik have comparable pixel dimensions but the respective fringe periods differ considerably. These results do not depend on the orientation of the sensor with respect to the slit, and the observations are highly reproducible.
Another result is obtained when different regions of the spectrum are observed by varying the center wavelength of the spectrograph. The fringe period is clearly dependent on the center wavelength. An example is shown in Fig. 4.
Fig. 4: Dependence of fringe period ![]() on center wavelength, Atik camera
on center wavelength, Atik camera
We are confronted with three effects:
These observations suggest that the fringes originate inside the camera and that they are caused by internal reflections in the protective glass plate which is located in front of the sensor. This hypothesis will now be tested.
A collimated beam of light passing through a plane-parallel plate is affected by internal reflections (Fig. 5).
Fig. 5: Internal reflections in a plane-parallel plate
Depending on the wavelength ![]() , the intensity of the beam is either amplified or attenuated. Intensity maxima occur if the following condition holds [2]:
, the intensity of the beam is either amplified or attenuated. Intensity maxima occur if the following condition holds [2]:
where ![]() are the angles of incidence and refraction, n and n' the refractive indices of the surrounding medium and the plate, h the plate thickness, and m the order of interference. If the sensor is illuminated by light coming from a spectrograph, wavelengths are mapped to pixel positions. Thus, a plane-parallel plate inserted between the spectrograph and the sensor chip modulates the light intensity along the wavelength axis, as observed in Figs. 3 and 4. The distance between the fringes, the fringe period
are the angles of incidence and refraction, n and n' the refractive indices of the surrounding medium and the plate, h the plate thickness, and m the order of interference. If the sensor is illuminated by light coming from a spectrograph, wavelengths are mapped to pixel positions. Thus, a plane-parallel plate inserted between the spectrograph and the sensor chip modulates the light intensity along the wavelength axis, as observed in Figs. 3 and 4. The distance between the fringes, the fringe period ![]() , corresponds to a change in order m by one. For a plate illuminated at a right angle with a thickness much greater than the wavelength, the fringe period is approximated by
, corresponds to a change in order m by one. For a plate illuminated at a right angle with a thickness much greater than the wavelength, the fringe period is approximated by
This equation is now applied to the observations. If the observed fringes were caused by a glass plate, the quantity
would be a constant and be equal to the optical thickness of the glass plate. This assumption was checked by measuring the fringe period ![]() at several wavelengths
at several wavelengths ![]() in the spectrum of the halogen lamp. The results are as follows:
in the spectrum of the halogen lamp. The results are as follows:
| Approx. center wavelength |
Fringe period |
|||||
| Canon | Meade | Atik | Canon | Meade | Atik | |
| 5380 | 1.757 | 1.208 | 1.307 | 0.822 | 1.193 | 1.116 |
| 5870 | 1.440 | 1.545 | 1.193 | 1.113 | ||
| 6080 | 2.245 | 1.550 | 1.670 | 0.824 | 1.193 | 1.108 |
| 6390 | 1.712 | 1.844 | 1.191 | 1.107 | ||
| 6520 | 1.779 | 1.934 | 1.193 | 1.100 | ||
| 6700 | 2.707 | 1.887 | 2.038 | 0.828 | 1.187 | 1.101 |
| Precise values were measured individually for each camera | Statistical error of |
|||||
Table 1: Variation of the fringe period with wavelength
For each camera the quantity ![]() is indeed a constant and may be interpreted as the optical thickness of the glass plate in front of the sensor chip.
is indeed a constant and may be interpreted as the optical thickness of the glass plate in front of the sensor chip.
Strictly speaking the above considerations are not absolutely correct. We assumed that the sensor is illuminated by a collimated beam of light. But in the case of the LHIRES spectrograph the beam is converging at a f-number of 10. However, fringes of the observed type will only gradually disappear when the beam is changing from collimated to convergent. This was verified experimentally by stopping down the lens illuminating the slit. And since the plate thickness is determined by the fringe period alone, variations in the fringe amplitude don't matter. A further implicit assumption concerns the interface between the glass plate and the sensor which is supposed to be air. This could be verified for the Atik and Meade cameras by looking at the sensors under a microscope. The situation is more complicated in the case of the Canon camera. The sensor is covered by a stack of filters (Fig. 6), and the ripple effect may not be traced back to a single glass plate.
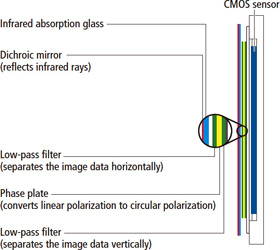
Fig. 6: Structure of the Canon Low-Pass Filter
If fringes show up by transmitted light through a glass plate, they must also be visible in reflected light. To check this assumption each camera sensor was observed with an interferometric setup according to Haidinger [3].
The glass plate covering the sensor is illuminated by an extended source of light which consists of a He-Ne laser, a beam expander (pinhole and telescope lens), a diffusing screen and a beam splitter (Fig. 7).
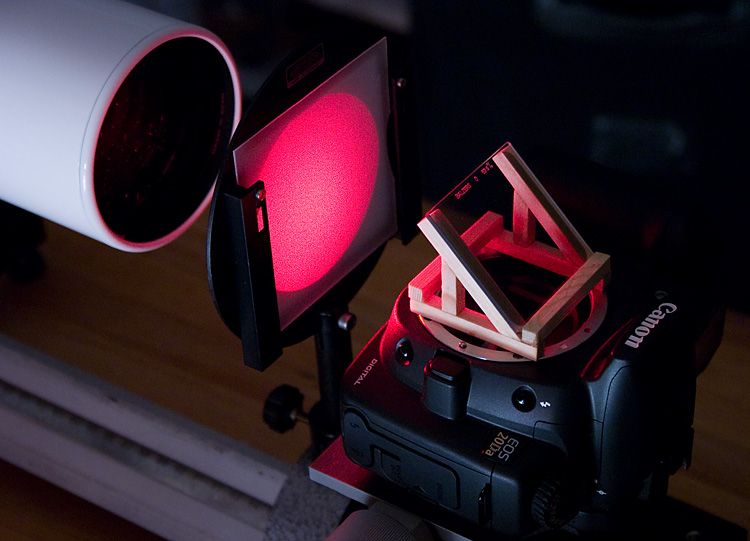
Fig. 7: The Canon camera in the improvised Haidinger interferometer
A conventional photographic camera with a lens focused at infinity observes the plate through the beam splitter. In a Haidinger setup, a plane-parallel plate produces concentric fringes due to reflected light from both surfaces of the plate. This was in fact observed (Fig. 8).
Fig. 8: Haidinger fringes of two sensors in the diffused light of a He-Ne Laser
By analyzing the concentric fringes the quantity h/n' may be derived. As before, h is the thickness and n' the refractive index of the glass plate. For each camera we have now two independently measured values: n'h by means of the ripple in the halogen lamp spectrum, and h/n' by means of the Haidinger fringes. This allows us to derive individual values for n' and h. The results are as follows:
| Make | Model | Refractive index n' | Thickness h (mm) |
| Canon | 20Da |
1.55 |
0.53 |
| Meade | DSI II PRO |
1.48 |
0.81 |
| Atik | ATK-1HS II |
1.48 |
0.75 |
Table 2: Refractive index and thickness of the glass plate covering the sensor at 6328 Å
For the Atik and Meade cameras, the plate thickness was verified under the microscope. This wasn't possible with the Canon camera, where the fringes may be produced by one ore more elements of the stacked filter.
The observed fringes appearing in the spectrum of a continuous source are caused by the wavelength selective action of the glass plate or filter covering the sensor chip. In the visible part of the spectrum, a glass plate of 1 mm thickness leads to a fringe period of 1 Å. Therefore the fringes appear only in spectrographs with a resolution greater than a few thousand.
The effect of the ripples on measured spectra may be removed in the calibration process by flat-fielding. Since the ripple amplitude depends on the geometry of the light path entering the spectrograph, it is very important that the instrumental setup remains the same for taking the spectra and the flat-fields.
A few questions remain to be answered. For instance some spectrograph-camera combinations don't show any fringes at all. This may be due to slight variations in the adjustment of the optical path: fringes are disappearing when the sensor is tilted with respect to the optical axis of the spectrograph. But this has to be verified in more detail.
[1] www.shelyak.com
[2] M. Born and E. Wolf, Principles of Optics, 7th (expanded) edition (Cambridge University Press, 2005), p. 313
[3] D. Malacara, Optical Shop Testing, Second Edition (John Wiley, 1992), p. 36
[4] www.canon.com/technology/canon_tech/explanation/lowpass_filter.html