
|
|
Those Peculiar C and S Type Stars |
Among all the stars of the heavens, there exist a small sub-group, which has served as a key to our understanding of stellar evolution through spectroscopic examination. These stars are called the carbon stars (C type) and the S stars and they are related to each other. These represent stars of the initial mass range from ~0.8 solar mass to ~8 solar masses. They also represent stars in the later stages of their evolution. These stars are peculiar because of their high ratio of carbon to oxygen and the often-high abundance of heavy elements they contain, which are synthesized by the slow neutron capture process. They are also long period variable stars, often of the Mira class.
Contrary to what most amateurs believe, most heavy elements are not made in super-nova explosions but rather by the quite process of neutron capture in lower mass evolved stars. These elements ultimately find their way back into interstellar space via planetary nebula. I have been exploring the spectrum of these stars to the degree possible with off the shelf amateur equipment and this paper explores some of the things I have discovered along the way.
My primary instrument for spectroscopy is a Celestron 14, which has had a Byers retrofitted drive system. The Santa Barbara Instrument Group (SBIG) Self Guiding Spectrometer (SGS) is linked to the telescope with a focal reducer giving a final f6 ratio. The CCD camera attached to the spectrometer is the SBIG ST-7E with 9-mm pixel size. The SGS instrument appeared on the market during the later half of 1999 and was aimed at a sub group of amateurs with special interest in the field of spectroscopy.
The light from the telescope reaches the entrance slit, which can be 18 or 72-mm wide. The light passes through the slit and reaches the grating and ultimately the CCD cameras imaging chip. The remaining field of view is observed on the guiding CCD chip of the camera and allows the viewer to select a field star to guide upon once the object of interest is centered on the slit. In this paper only results obtained using the 18-mm slit will be presented. The SGS features a dual grating carousal, which, with the flip of a lever, allows dispersions both in the low-resolution mode (~ 4 Angstroms/pixel, ~ 400 Angstroms/mm) or higher resolution mode (~1 Angstrom/pixel, ~100 Angstroms/mm). In the low-resolution mode, about 3000 Angstrom coverage is obtained whereas in the high-resolution mode, about 750 Angstroms. Wavelength calibration was carried out using emission lines from hydrogen and/or mercury gas discharge tubes. Absorption and emission line identifications were carried out using tables from the Handbook of Chemistry and Physics.
The currently believed interrelationships between the cooler M, S and C type stars are shown in Figure 1. As stars evolve into S and C stars, a number of changes are observed to occur in their outer atmosphere and these changes can be documented by examination of their spectra.
 |
| Figure 1. As stars of ~0.8 to 8 solar masses evolve away from the main sequence, they expand and cool and move into the red giant M type stars. From here they enter into a thermally pulsing phase where alternating burning of hydrogen to helium, helium burning to carbon and phases of slow neutron capture reactions. Intermittent convection sets in bringing many of these heavy elements to the surface including carbon and zirconium. As a result, enhanced s-elements are observed, increased carbon as expressed as a C/O ratio and the newly made zirconium has a higher affinity to react with free oxygen than titanium, resulting in the disappearance of TiO bands and the appearance of ZrO bands in their place. Either of these molecular species can be observed only in cooler stars such as M, S or C types. Whether the SC transitional class actually exists remains a bit controversial. |
For example, one often observes an enhancement of s-elements in their atmospheres. These are elements synthesized by the slow neutron capture method in shell regions around the core of these stars. More will be said about this later. In addition, the carbon/oxygen ratio increases in these stars from a typical value of 0.4 up to values often greater than 1. Finally, the molecular bands of titanium oxide (TiO) observed in the spectra of cooler M type stars often disappears and are replaced by zirconium oxide (ZrO) bands. (Zirconium is a slow neutron capture element). So, just where do these stars lie on the Hertzsprung-Russell diagram?
Figure 2 shows this diagram with the main sequence indicated. The main sequence represents where the vast majority of stars are found. These are "normal" stars in that they are burning hydrogen into helium in their cores. When stars have exhausted this hydrogen, they begin to evolve. How this evolution will proceed depends upon the mass of the star. Our discussion will focus on stars in the mass range of 0.8 to 8 solar masses. In this range, which includes the sun, stars migrate to the right of the diagram and upward. The green paths represent two such migrations for two different mass stars.
These stars outer atmospheres expand and cool as helium ignition begins in the core and hydrogen burning in a shell around the core gets underway. As the stars cool they become M type stars and enter a region of the H-R diagram populated by long period and MIRA type variable stars. It is while stars are in this region of the H-R diagram that some very interesting things occur. Figure 3 is an enlargement of Figure 2 focusing on the variable star region of the diagram. It is while stars are in this region of the diagram that a series of nuclear reactions take place with profound consequences.
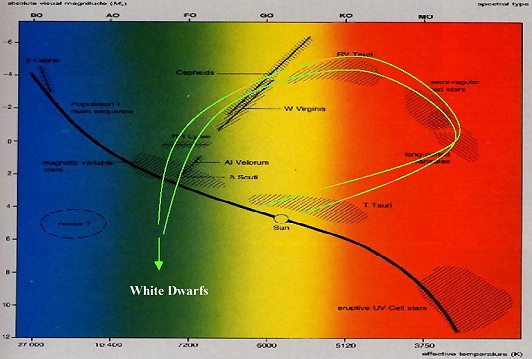 |
| Figure 2. The Hertzsprung-Russell diagram showing the main sequence as a black line and various other areas where variable stars of different types are found. The green lines indicate the paths of evolution followed by typical stars in the solar mass range when they have exhausted their hydrogen supply in the core. They migrate into the region M type stars and long period variables of the Mira type (farthest right). After spending some time in this region, they ultimately shed their outer layers as planetary nebula and the stars enter into the white dwarf region. |
Stellar evolution models show that while stars are residing in this area of the HR diagram they undergo a series of thermal pulses in which alternating burns of hydrogen to helium and helium to carbon can occur.
At certain times during these alternating burns, there are regions where significant quantities of an isotope of carbon get made, 13C, which contains one extra neutron in its nucleus over normal 12C.
At certain times during these alternating burn-rest periods, conditions can be appropriate such that the 13C can fuse with helium yielding oxygen and, most importantly for our purposes, a free neutron.
This appears to be the main source of neutrons for the slow neutron capture process and initiates at a temperature of ~1 x 10⁸ K. Another process that is relatively miner, but requires higher temperatures, is the burning of 22Ne to give 25Mg. Now, free neutrons do not survive very long, having a half-life measured in minutes. But the important thing about neutrons is that they can enter into and fuse with the nuclei of other heavy atoms without the temperature requirements usually required for fusion of nuclei to heavy elements.
At times in between these pulses, convection sets in and some of the material cooked up in these processes get dredged up and appear in the outer atmospheres of these stars. This represents the slow neutron capture process and can synthesize heavy elements beyond the most stable nuclei, iron. But before we proceed further, lets discuss this process.
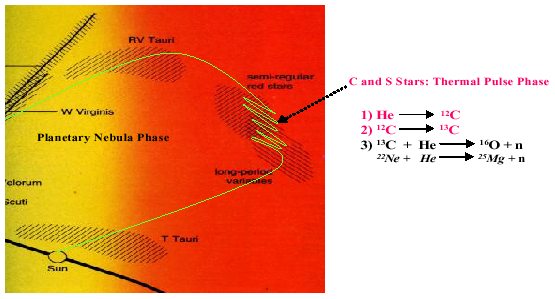 |
| Figure 3. Close up of the region where stars enter the variable region of the H-R diagram and the thermal pulsing phase. In this phase, which can last a few million years, helium and hydrogen burning occur out of phase with each other and slow neutron capture reactions occur. The source of the neutrons appears to be 13C with possible small contributions from 22Ne. Dredge up periods between these episodes carries some of these products to the surface. Eventually, many of these slow neutron capture elements find their way back to interstellar space during the planetary nebula phase. |
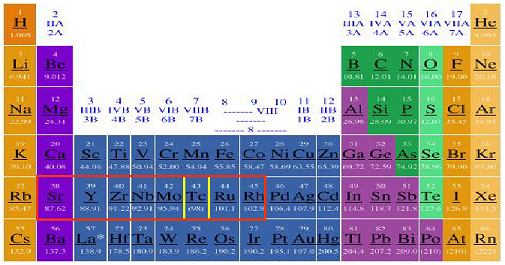 |
| Figure 4. Periodic table of the elements with the typical s-elements made by slow neutron capture outlined in red. The unstable element technetium is outlined in yellow and is often present along with other s-elements in the C and S type stars. |
Shown in Figure 4 is the periodic table with the typical slow-neutron capture elements obtained in stars with similar metal content as the sun outlined in red. The abundances of these elements are often greatly enhanced in C and S type stars. The key element to our understanding of these stars as they evolve has been element 43, technetium, outlined in yellow. This element does not possess any stable isotopes and is not found naturally on the earth today.
 |
| Figure 5. The isotope table represents the 3rd dimension to the periodic table. Shown here is a small portion of the isotope table. Each element in the periodic table possesses many isotopes, some of which are stable (black boxes) others are unstable. The unstable ones may have very long or short half-lives. An unstable isotope will decay to give a different element. View the isotope table as a valley with the valley of stability in black running diagonally upward to the right. When a stable nucleus absorbs a free neutron, it moves to the right in the table. Eventually, it can become an unstable nucleus. For example, 64Ni absorbs a neutron via the slow neutron capture process (red arrows), to become 65Ni. This isotope decays by beta emission (blue arrows) to become 65Cu, one element up in the table. This element can absorb another neutron when free neutrons are readily available to become 66Cu, again unstable and decaying to 66Zn. Some isotopes can take 2 different decay pathways such as 64Cu, which can either beta decay to 64Zn or positron emission (yellow arrows), becoming 64Ni. The formations of new unstable isotopes followed by decay processes are ultimately attempting to return isotopes back to the valley of stability. The complex network of reactions resulting from this process leads ultimately to synthesis of stable heavy elements up to lead and bismuth. |
It's most stable isotope has a half-life of only a few million years so all that might have been present in the early earth has long since disappeared. The observation of this element in these type stars in the early 1950's, and subsequently in many of the C and S type stars indicates that it must be made in situ and appear in the outer layers of the star to be detected. Thus, a mechanism must exist which can make heavy elements, beyond the most stable element iron. This is the slow neutron capture process.
In order to grasp how this process can make heavier elements you must first look at the periodic table in a new way. The periodic table is really a 2-dimensional representation of stable elements. However there is a third dimension, the isotopes of each element. As an example, consider the element nickel (Ni) in Figure 4 above and then look at Figure 5 below. Ni is shown in the bottom row of what is known as an isotope chart. The black color shows the stable isotopes of nickel, or other elements. In this chart, increasing atomic number or element proceeds upward along the y-axis while differing number of neutrons in a particular nucleus is shown along the x-axis. When the slow neutron capture reactions are initiated with the burning of 13C, nickel seed nuclei can absorb the free neutron and migrate toward the right on the isotope chart (red arrows).
Eventually, an unstable nucleus is reached, such as 63Ni, which then is radioactive and decays by beta emission along the blue arrows. The reason that the slow neutron capture process is "slow" is that when an unstable nucleus is made by this process, there is sufficient time for the unstable nucleus to decay before it can capture a further neutron. This results in a nucleus of the same mass, but moved up one element, now to 63Cu in our example. This element can now absorb a free neutron and follow the same pattern. In some cases isotopes are made that can decay along different paths such as 64Cu which can follow the route up to 64Zn or downward to 64Ni. Multiply this process among all stable heavy element seed nuclei and the result is a vast interconnected network of reactions, which proceeds from lighter to heavier nuclei.
This is the process by which most heavy elements beyond iron are actually made in the universe. The thermal pulsing phase does not last long, only a few million years. This is the reason not many stars are found in this area of the H-R diagram. Once this evolutionary phase is over the star enters the planetary nebula phase where the outer layers are shed back into space, now laced with heavy elements. The stellar remnant moves horizontally to the left across the H-R diagram and downward to become a white dwarf (see Figure 2). Many of these s-elements, including technetium can be detected in the outer atmospheres of these type stars.
 |
| Figure 6. High-resolution spectrum of RS Cancer covering the blue region of the spectrum. Several absorption lines of slow neutron capture elements are indicated in the figure. |
Shown in Figure 6 is the spectrum of RS Cancer, an S-type star with several of the s-elements identified in its spectrum. The other noteworthy fact about these types of stars is, as mentioned earlier, the greater C/O ratios observed. The helium burning, which is occurring in the core of these stars results in a build up of carbon. This burning stage is not steady but occurs in a cyclical manner with hydrogen burning in a shell around the core. This is the thermal pulsing, which takes place in these stars. In between these burning cycles, the star becomes unstable toward convection and as convection sets in, a period of "dredging up" occurs and results in products, made near the core, appearing in the outer layers and this includes significant quantities of carbon. Since pockets of another isotope of carbon, 13C, are also being made in the star at certain times, this isotope also appears on the surface along with the more common carbon isotope, 12C. The end result of this is that these stars, besides possessing increased C/O ratios also have decreased 12C/13C ratios. 13C exists naturally in the solar system and the value of the 12C/13C ratio is around 80.
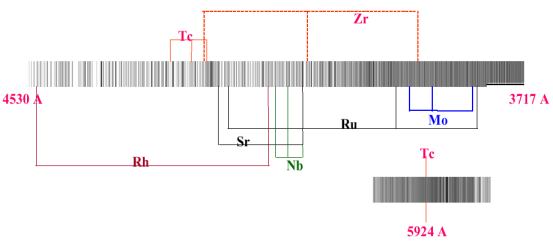
Some C stars can have ratios in the 3-5 ranges! By the way, stars with greater amounts of 13C are known as J type stars. It is not normally possible to measure isotopes of atoms or ions in spectra because the differences in line positions are extremely small. However, when different isotopes combine into molecules, the picture can change dramatically. This can be observed in the spectra shown in Figure 7 where the spectra of molecular diatomic carbon, C-C, are shown. In molecules, the rotational and vibration states, which are highly sensitive to the masses of the atoms involved, can couple to electronic transitions and result in a significant change in the wavelength of the lines observed. In the upper part of
Figure 7, the lower spectrum is that obtained from a star, which has the solar system 12C/13C ratio. Only 12C-12C diatomic carbon is observed. The middle pair of spectra was obtained from 2 different C stars with 12C/13C ratios around 20. Notice the appearance of 12C-13C diatomic carbon. Finally, the upper pair of spectra was obtained from two different stars with 12C/13C ratios near 5. There are sufficient 13C to lead to the formation of 13C-13C diatomic carbon, in addition to 12C-13C diatomic carbon and 12C-12C diatomic carbon.
The lower aspect of Figure 7 shows graphical representation of these results. In spite of what we amateurs have believed to be the source of heavy elements, the fact is that a majority of the heavy elements above and beyond iron are made in lower mass stars not associated with supernova. The vast majority of stars will pass through the thermally pulsing phase during the course of their evolution off the main sequence.
During this time, heavy elements will be synthesized during the slow neutron capture burning cycles that occur in these stages, followed by mixing and ultimately shedding of the outer layers back into space during the planetary nebula phase. Granted, supernovae are dramatic and spectacular, both visually and in the production of heavy elements (via the r- or rapid neutron capture process), but there are so few of them that occur in relation to stars that pass through the thermal pulsing phases, that their actual contribution to heavy element synthesis is miner. The slow neutron capture process can only form some isotopes, while the rapid process can only form others. By careful analysis of the isotope composition of matter such as solar system material, it has become clear that the matter that makes up the solar system was made by both processes, but the majority has come from the slow neutron capture process.
Finally, to throw in some interesting tidbits, the burning of 13C with He to yield a neutron initiates at a temperature of 1 x 10⁸ K and the rate is extremely sensitive to temperature. The initiation of 22Ne burning to give 25Mg and a neutron initiates around 3 x 10⁸ K. As it turns out, the half-life of technetium is constant, around 2.6 million years up to 1 x 10⁸ K. Above this temperature, there is a very rapid decrease in technetium's half life such that by the time you get to a temperature at which burning of 22Ne occurs, technetium's half life is measured in a few days.
This seems hardly enough time for the technetium to survive the dredge up period and appear at the surface. However, calculations indicate that this shorter half-life may be offset somewhat by a greater quantity of technetium synthesized. Nonetheless, these temperature constraints would appear to limit the neutron source for slow neutron capture to the burning of 13C.
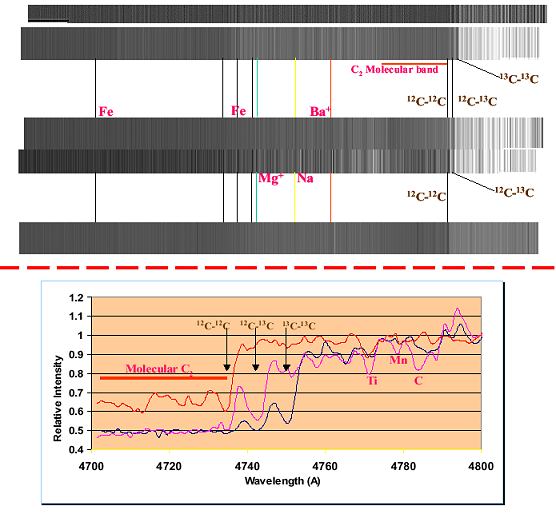 |
| Figure 7. High-resolution spectra of several C type stars , which have different ratios of 12C/13C. In the upper part of the figure, the lower spectrum shows the same data but in graphical format. The very low continuum observed to the left of these labeled lines is due to the blanket absorption often seen with molecules where large segments of the continuum are removed. |
Another interesting aspect, which comes from the calculations of stellar evolution and the slow neutron capture process, is that the lower the metallicity of a star, the heavier the elements made by the slow neutron captures process. Very low metallicity stars have greatly reduced seed nuclei, which accept the neutrons.
The result is that the ratio of neutrons to seed nuclei is higher and the peak of heavy elements made by this process gets pushed to higher atomic numbers, all the way up to lead and bismuth, the end of the line as far as stable atomic nuclei. Stars with solar like abundances of heavy elements produce peak elements in the strontium to rhenium area of the periodic table (outlined in red in Figure 4 above).
A majority of stars in the lower mass range of ~0.8 to 8 solar masses will evolve into a phase which lasts, astronomically speaking, briefly. During this time, they will alternatively burn hydrogen in a shell around the core and helium to carbon in the core. Episodes of slow neutron capture will occur during this phase of thermal pulses followed by dredge up periods in which heavy elements (>Fe) will be synthesized and deposited at the surface.
Eventually, these stars will pass into the planetary nebula phase and shed the majority of their outer envelopes into space yielding planetary nebula and white dwarf remnants. Most of the heavy elements in the periodic table are synthesized by this rather quiet method rather than by the dramatic supernova, which occurs only in a tiny fraction of all stars.
![]()