About the use of Sony A7s digital camera for astronomical spectroscopy
by Christian Buil

Fringes phenomenon
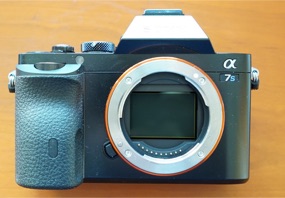
One of the purpose of this page is to show the phenomenon of interference fringes on a modified Sony A7s camera used for spectral high and medium resolution acquisition (click here for going to an general evaluation page of the camera). The modification of the device was conducted by company EosForAstro. It consists of a total unfiltering with the addition of a clear Astronomik MC glass. The goal is to get a camera sensitive in the near infrared part of the spectrum.
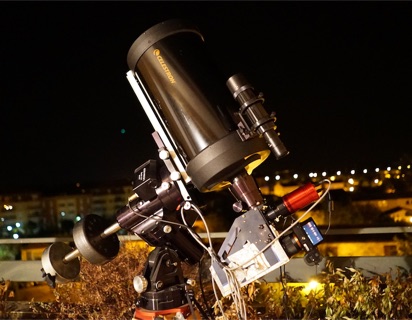
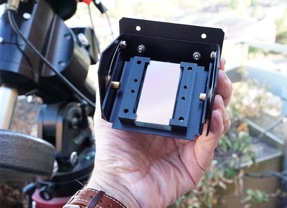
For test the spectrograph is a Lhires III model (Shelyak Instruments company). I use an Optometrics diffraction grating of 830 lines/mm specially blazed at 800 nm (reference 3-7880). The telescope is a C9.25 used at f/10.
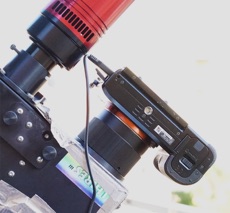
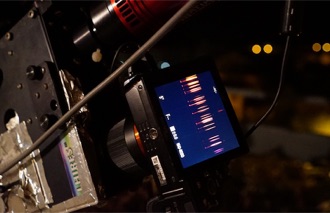
The Sony A7s is attached at the extremity of Lhires III spectrograph by means of a T-ring. The high sensitivity of this camera permit real-time verification of the shooting, thank to the « Live View » mode (here the spectrum of Lhires III internal neon lamp on the control screen) and also… instant gratification. The pixel size of detector is about 8.4 microns and the spectral dispersion is 0.47 A/pixel.
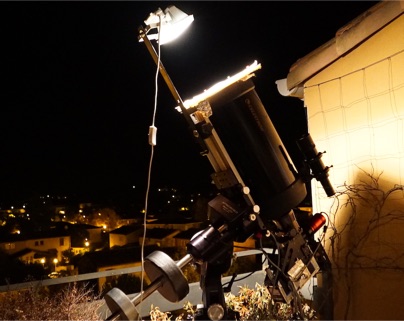
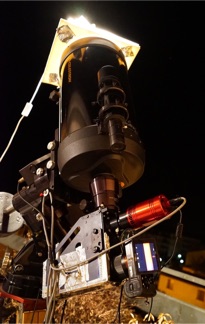
A key step in the acquisition procedure: the realization of the flat-field. Here I use a halogen lamp that illuminates the entrance of the telescope covered by a full pupil diffuser.

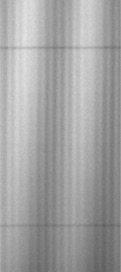
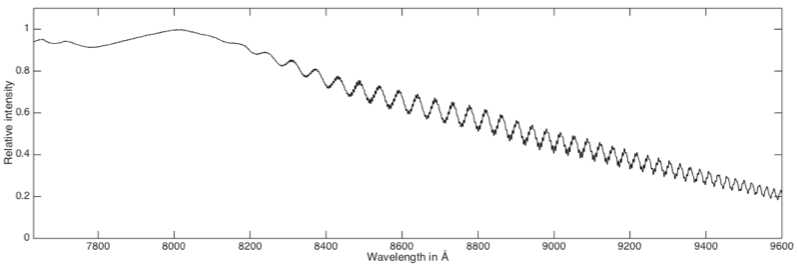
Top, the flat-field image carried with the equipment. The spectral axis is horizontal (the left wavelength is about 7600 A, the right is 9600 A). On the right view, a detail of the 2D spectrum. A dramatic double-wave structure is immediately obvious. The interference fringes are produced by internal reflections between two dioptric surfaces and/or into the detector substrate. The existence of this type of ripple is a well known phenomena, see here for example. But the amplitude is particularly important with the actual tested setup. The contrast of low-frequency fringes reached 10%, while it was 3% for the high-frequency fringes system.
The thickness e of the element responsible of interferences is calculated by the formula: e = λ2/(2 n Δλ), with n the refractive index (n=1.5 to 1.6 for a glass plate, n=3.6 for a Si substrate at 0.85 micron).
For the low-frequency system, the measured fringe period is Δλ=49 A at λ=8500 A wavelength. If we adopt n=1,52, we find e=0,048 mm, that it is a very low value. The origin of this interference is not clear. The calculated thickness is too small to fit a glass plate. Maybe the detector substrate ? For the high-frequency fringes we have Δλ=4,6 A at Δλ=8500 A. The corresponding thickness is 0,52 mm, consistent with the detector cover glass plate for exemple (to be confirmed).
Here, the flat-field intensity along the spectral axis (full spectral domain and a detail near 8550 A):

The Sony A7s spectrum of α Cas (spectral type K0III) before flat-field correction (9 October 2016):


The high and low frequency ripples are clearly visible. It is the crucial point. Our major problem is the temporal instability of the fringe pattern. Below, a demonstration on a part of Υ Cas star spectrum. The sequence represents only 6 minutes of observation (!). During this interval the shifting of the fringes is important (especially the wide period system). In these non reproducible conditions, the correct calibration of the fringes is virtually impossible. Temperature drift of the camera detector (not regulated) is a possible explanation ?
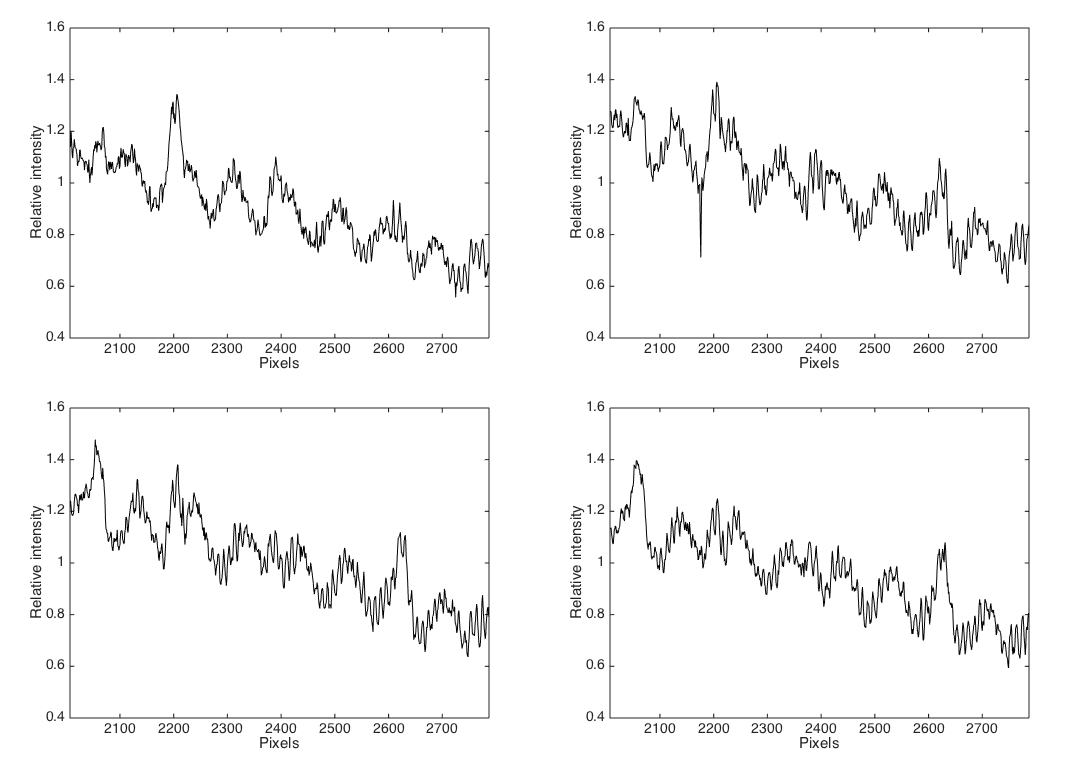
Below a more large portion of γ Cas spectrum, respectively before and after flat-field correction (the flat-field is captured only 5 minutes after science images with a minimum displacement of the telescope):


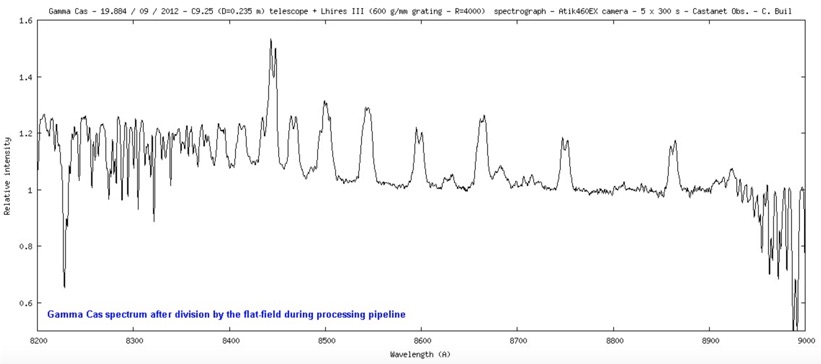
Only large fringes disappearing (partially only). Unfortunately, the intensity of high-frequency fringes is accentuated after the correction because this system has shifted between acquisition of science and calibration images (the fringes are nearly in opposite phase!). Compare this spectrum of the same star performed in 2012 with a CCD camera Atik460EX, with a correction level much more satisfying of the fringes (see details here):
In the present technical situation, a camera such as the Sony A7s, yet promising in terms of detectivity, can not be used for high and medium resolution infrared spectroscopy. The exact origin of the long period fringes is unclear at this stage (surface coating of the added clear filter ?). For infrared spectroscopy, a probably good idea is to modified the digital camera without the addition of the focus compensation glass plate (that is to say, by ensuring that the number of optical surfaces is minimized).

Comparison of unfiltered and filtered cameras
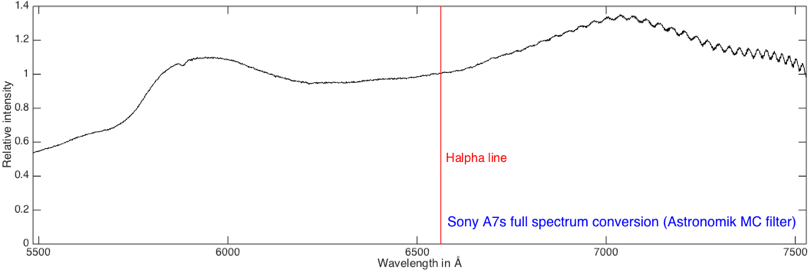
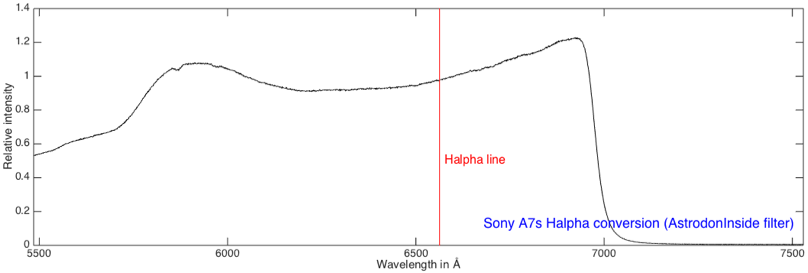
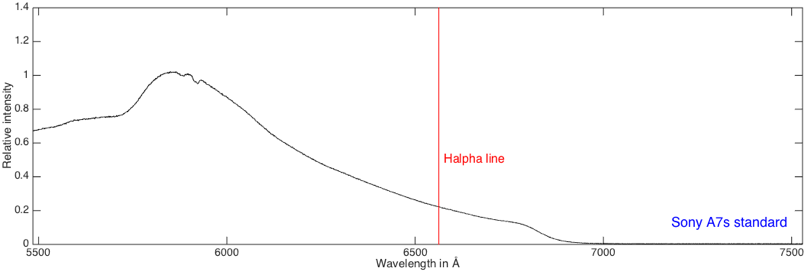
From top to bottom, the spectral profile of the IR flat-field spectrum (halogen lamp and blazed grating at 800 nm) taken with a A7s equipped with a clear filter, the profile taken with a specially A7s modified for capture H-alpha line, the profile taken with a standard A7s (unmodified). The intensity is calculated as the sum of the signal observed in the RGB pixels of the Bayer mask (the images are processed with ISIS software).


2D version of the captured flat-field spectra. Note the presence of very faint fringe (inclined) with the modified H-alpha A7s near 680 nm, and also of course with the IR modified camera.
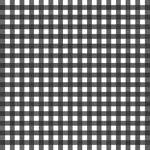
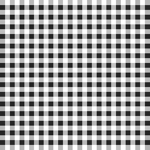

Bayer mask aspect according to the wavelength (high magnification of an image portion). Left at 650 nm, center at 750 nm, right at 850 nm. At 650 nm, a pixel on four of the Bayer matrix actually records the signal (the relative measured sensitivity of RGB channels is respectively 1.00, 0.21, 0.11). At 850 nm, the RGB channels response of the Bayer matrix is similar (the RGB measured relative sensitivity is 1.00, 0.99, 0.92). At the latter wavelength, the detector works in black and white mode (Bayer mask structure becomes imperceptible, changes are due to noise). The unfiltered digital photographic cameras are attractive in the infrared if we consider sensitivity and have the same behavior as a black and white CCD.

Comparative A7s detectivity
I have also compared the Sony A7s sensitivity with an Atik460EX CCD camera (Sony ICX694L detector). For this, I observed the star beta Auriga with the same equipment, simply by changing the camera. Observation is performed the same night with a photometric slit (230 microns width). The exposure time is 30 seconds.
At 8500 A, the measured bin signal with the Atik460EX is 13800 ADU for a spectral sample of 0.25 A/pixel, or 54200 ADU/A. The adopted camera gain is 0.26 e-/ADU, so the observed signal is 14100 e-/A for a 30 sec exposure. Finally, electronic signal rate is 470 e-/A/s.
For the Sony A7s, the measured signal is 2660 ADU (on one green Bayer pixel) for a spectral bandwidth of 0.47 A/pixel, so we have a signal of 5660 ADU/A. The estimated camera gain is 0.79 e-/ADU (4000 ISO), so the signal in electrons is 4470 e-/A and the signal rate is 149 e-/A/s.
The sensitivity of CCD camera is 470/149=3 (with error margin) better compared to digital photographic camera, but a more important parameter is detectivity. The typical readout noise (RON) of the considered CCD camera is 5.2 e- per pixel. For the Sony A7s we have a RON of nearly 1.1 e- per pixel. Finally, in terms of detectivity (my definition is here the ratio of responsivity — proportional to quantum efficiency — by the noise), the Sony seems to be 1.5 times more efficient than the Atik camera. But It must be careful: pseudo-noise sources are more numerous with A7s because the pixel size, the Bayer mask structure, exposure time limited to 30 seconds… and the fringes very critical problem if it is not fixed !

About Sony A7s 30 seconds exposure limitation
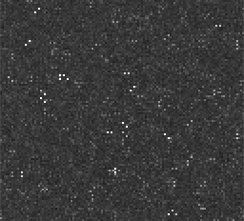

Why it is not possible to achieve a longer astronomical exposure than 30 seconds with the Sony A7s current firmware?
When the Bulb mode is activated, the internal software execute a procedure to filter the hot dark points. At the same time, the stars and the finest details in the image are also erased. It is not acceptable for serious observers. The choice of Sony's is absurd, especially as the dark signal is very moderate in this unit and easy to eliminate by using an elementary and standard thermal signal calibration procedure.
On the left, an exposure in the dark of 5 minutes duration (300 seconds) conducted in Bulb mode (detail). On the center, the sum of 10 elementary 30 seconds frames in the standard shooting mode (30 seconds is the maximum available in this mode). On the right, the comparison of these two images.
The effect of the algorithm used to reduce the thermal signal is clear: an unnatural noise structure, all the hot spots are not erased ... and artifacts appear (ironically as hotspots). Bad point for Sony. Fortunately the detectivity (capacity to detect faint details) of this unit is very high, which allows to exploit for deep sky imagining (and spectroscopy) with many added 30 seconds exposures (but it's very heavy anyway). The results would be so great if Sony not destroy « raw » images in Bulb mode…

How to attach an Alpha 7s camera to the Alpy 600 spectrograph (Shelyak Instruments)
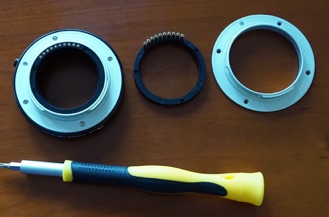
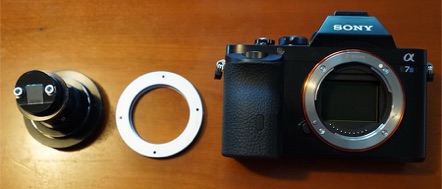
First a E-mount is recovered from a low-cost extension tube sets for macro photography.
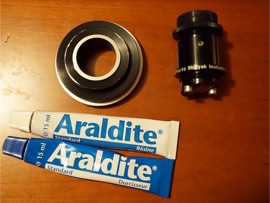
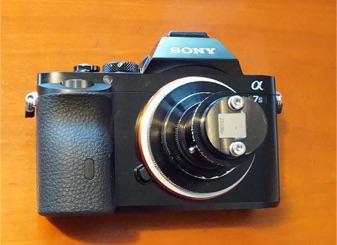
Then, the Alpy 600 spectrograph female ring interface is attached to the E-mount plane surface by using an effective epoxy glue. Spectrograph backfocus is now perfectly adapted to the Sony A7s, allows a fine focus of the spectrum with the integrated Alpy 600 devoted system. The result: An excellent educational project for introduction to spectroscopy, for sky survey pollution, for cool science…

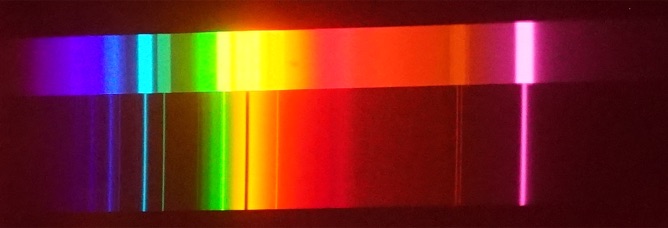
Domestic fluorescent lamp spectrum. The zero order image is on the left. Use of the Alpy 600 spectrograph attached to a IR-cut removed Sony A7s. The spectrograph entrance slit a photometric mode: 230 microns in the upper part, 23 microns in the bottom part. The image presented here is from the JPEG original file (« true » colors).
Street sodium high pressure lamp spectrum.


Sun light spectrum (B&W version). A red order filter is used for capture infrared part. For this resolution the fringe problem is absent.