ISIS
Version
5
Utilisation
de Gnuplot sous ISIS
Use
Gnuplot under ISIS
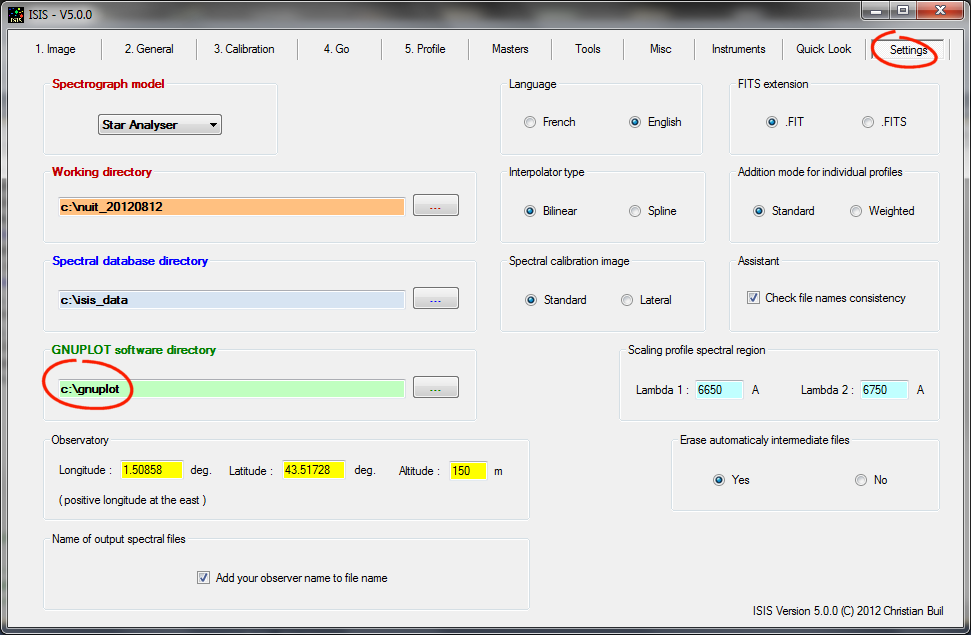
Télécharger la version 4.4 ou supérieure de GNUPLOT et installez là sur votre ordinateur. GNUPLOT est disponible gratuitement ici : http://www.gnuplot.info/
Vous êtes tout à fait libre du choix du dossier d'installation, mais vous devez désigner dans ISIS le répertoire en question. Supposons que vous installez Gnupot dans le dossier :
C:\GNUPLOT
Ouvrez l'onglet "Configuration" de ISIS, puis faire :
Download GNUPLOT version 4.4 or higher and install it on your computer. GNUPLOT is available here: http://www.gnuplot.info/You are entirely free of the choice of instalation folder. But inform ISIS. Suppose this intallation directory:
C:\GNUPLOT
Open ISIS "Settings" tab, then:
Ci-après, l'interface caractéristique de GNUPLOT sous Windows :
Below, the GNUPLOT interface under Windows: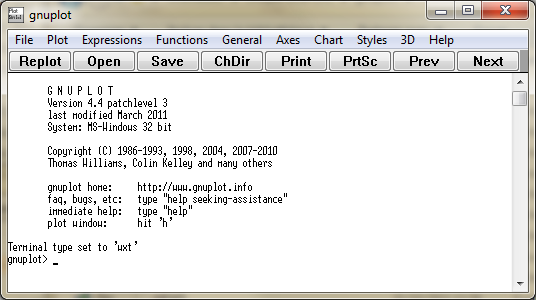
Les fichiers de script STD.GNU, STD2.GNU et STD2Y.GNU doivent être copier dans la racine du répertoire d'installation du logiciel GNUPLOT, comme le montre la copie d'écran suivante :
Script files STD.GNU, STD2.GNU STD2Y.GNU must be copied to the GNUPLOT installation root directory , as shown in following screenshot: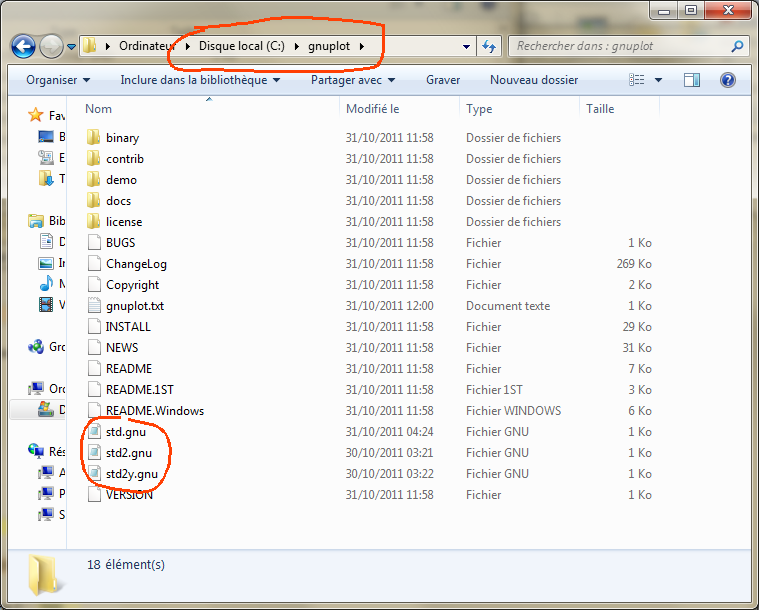
Les trois fichiers de script en question, qui correspondent à des modes d'affichages distinct des profils spectraux (voir plus loin), sont aussi regroupés dans un fichier ZIP, téléchargeable ici.
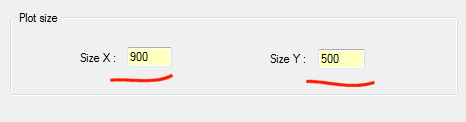
L'ordre de passage des paramètres d'affichages dans ces scripts doit être conservé. En revanche, vous avez la possibilité de modifier l'aspect de cet affichage, par exemple la taille du graphe (900 x 500 par défaut dans le script STD.GNU à titre d'exemple) ou encore le titre des axes. Ces scripts peuvent être manipulés depuis un traitement de texte (NotePad par exemple). En version de base, ces scripts affichent le graphique à l'écran et parallèlement, produisent un fichier infographique PNG dans le répertoire de travail courant de même graphique.
The three script files in question, which correspond to distinct display modes of spectral profiles (see below), are also grouped in a ZIP file, download here.The parameters order in these scripts should be conserved. However, you can change the look of the display, for example the graph size (900 x 500 default in the script STD.GNU for example) or the title of the axes. These scripts can be edited from a word processor (eg Notepad). In the basic version, these scripts display the graph on the screen and in parallel, producing a PNG computer graphics file in the current working directory of the same graph.
Le
fichier script STD.GNU :
The
script file STD.GNU:
#============================================================
#
GnuPlot script : STD.GNU
#============================================================
#
Parameter 0 : input data file
# Parameter 1 : graph title
#
Parameter 2 : min X:max x
# Parameter 3 : min y:max y
# Parameter
4 : Size X, Size y
# Parameter 5 : output file (PNG format)
#============================================================
# -------------------------------------
#
Setting
# -------------------------------------
set xlabel
"Wavelength (A)"
set ylabel "Relative intensity"
set
title '$1' offset 0,-0.5
set tmargin 2
set xrange [$2]
set
yrange [$3]
set terminal push
# -------------------------------------
#
Plot on the computer screen
# -------------------------------------
set
terminal windows "Arial" 9
plot "$0" notitle
with lines lc rgb 'black'
# -------------------------------------
#
Plot on a PNG file
# -------------------------------------
set
terminal png small size $4
set output '$5'
replot
# -------------------------------------
#
Finalize
# -------------------------------------
set output
set
terminal pop
reset
Le fichier STD2.GNU
:
The script file
STD2.GNU:
#============================================================
#
GnuPlot script : STD2.GNU
#============================================================
#
Parameter 0 : input data file #1
# Parameter 1 : input data file
#2
# Parameter 2 : graph title
# Parameter 3 : min X:max x
#
Parameter 4 : min y:max y
# Parameter 5 : size x, size y
#
Parameter 6 : label #1
# Parameter 7 : label #2
# Parameter
8 : ouput file (PNG format)
#============================================================
# --------------------------------------
#
Setting
# --------------------------------------
set xlabel
"Wavelength (A)"
set ylabel "Relative intensity"
set
xrange [$3]
set yrange [$4]
set tmargin 2
set title '$2'
offset 0,-0.5
set terminal push
# ------------------------------------
#
Plot on the computer screen
# ------------------------------------
set
terminal windows "Arial" 9
plot "$0" title
"$6" with lines lc rgb 'blue'
replot "$1"
title "$7" with lines lc rgb 'red'
# ------------------------------------
#
Plot on a PNG file
# ------------------------------------
set
terminal png small size $5
set output '$8'
replot
# ------------------------------------
#
Finalize
# ------------------------------------
set output
set
terminal pop
reset
Le fichier STD2Y.GNU
:
The
script file STD2Y.GNU:
#============================================================
#
GnuPlot script : STD2Y.GNU
#============================================================
#
Parameter 0 : input data file
# Parameter 1 : graph title
#
Parameter 2 : min X:max X
# Parameter 3 : min y1:max y1
#
Parameter 4 : min Y2:max y2
# Parameter 5 : Size X, Size y
#
Parameter 6 : output file (PNG format)
#============================================================
# -----------------------------------------
#
Setting
# -----------------------------------------
set xlabel
"Wavelength (A)"
set ylabel "Relative intensity"
set
tmargin 2
set title '$1' offset 0,-0.5
set xrange [$2]
set
yrange [$3]
set y2range [$4]
set y2tics border
set ytics
nomirror
set terminal push
# ----------------------------------------
#
Plot on the computer screen
# ----------------------------------------
set
terminal windows "Arial" 9
plot "$0" notitle
with lines lc rgb 'black'
replot "$0" axes x1y2 notitle
with lines lc rgb 'gray70'
# ----------------------------------------
#
Plot on a PNG file
# ----------------------------------------
set
terminal png small size $5
set output '$6'
replot
# ----------------------------------------
#
Finalize
# ----------------------------------------
set outpu
set
terminal pop
reset
Ces scripts sont utilisés par ISIS lorsque vous lancez l'affichage de profils spectraux depuis l'onglet GNUPLOT :
These scripts are used by ISIS when you start the display of spectral profiles from the GNUPLOT tab: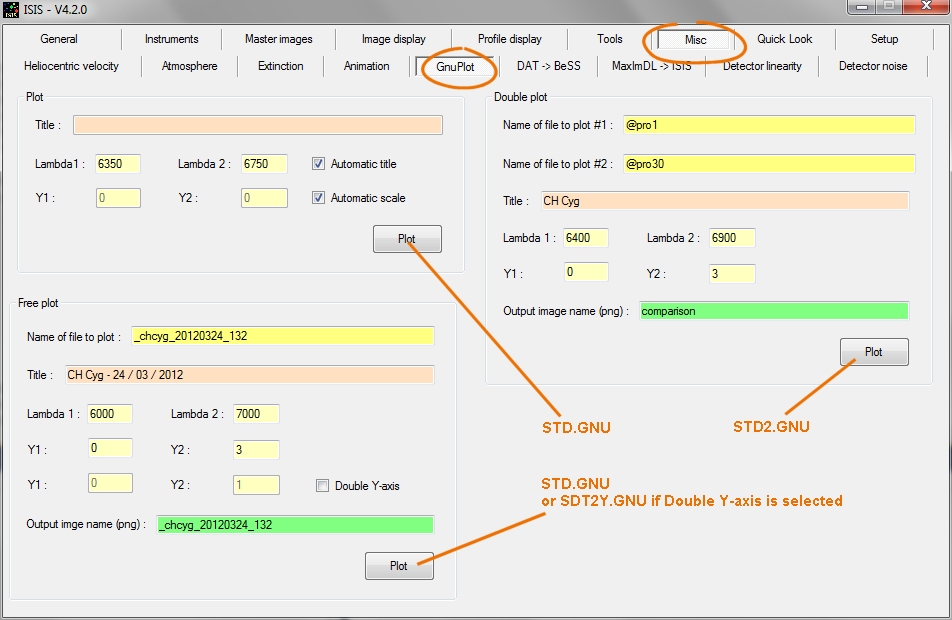
L'intallation de l'interface GNUPLOT de ISIS est à présent terminée.
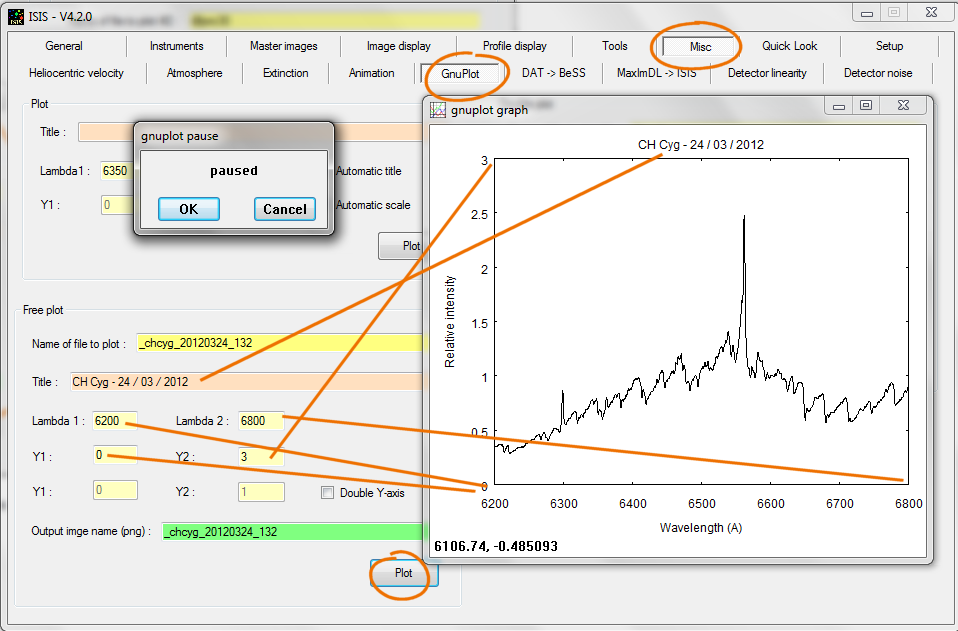
The installation of ISIS the interface to GNUPLOT is now complete.Un exemple d'utilisation de GNUPLOT depuis ISIS :
Example of GNUPLOT use from ISIS interface :
Depuis la version 5 de ISIS vous pouvez aussi fixer la taille du graphique de sortie depuis l'interface :
Since ISIS V5, you can now adjust size the output graphic from the interface:
Simultanément, ISIS produit dans le répertoire de travail un fichier au format PNG, dont vous pouvez modifier le contenu dans un logiciel d'infographie ou copier dans un logiciel de traitement de texte. Dans notre exemple, ce fichier a pour nom _chcyg_20120324_132.png.
Simultaneously, ISIS product in the working directory a PNG format file. Of course, you can change the content of this graphic file by using a computer graphics software or copy the content in a word processing software. In our example, this file has the name _chcyg_20120324_132.png.Noter que le fichier d'entrée doit être au format FITS. Si vos données sont au format DAT vous devez au préalable les convertirs en format FITS. ISIS propose un outil pour cela :
Note that the input file must be in FITS format. If your data is DAT formatted DAT you must first convert it in a FITS format. ISIS offers a tool for this: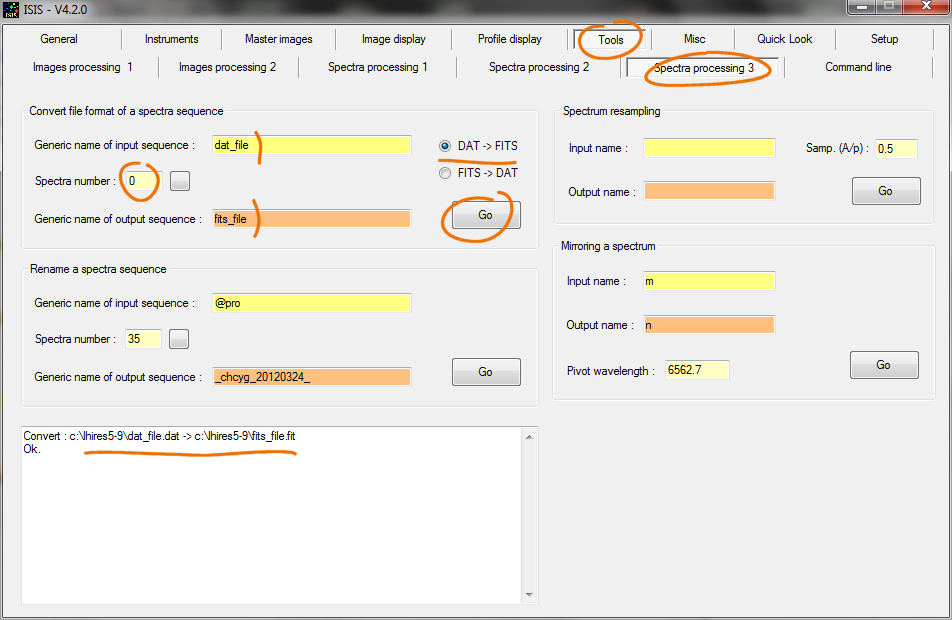
Dans l'exemple on réalise la conversion d'une image unique non indexée. C'est la raison pour laquelle on entre 0 pour le nombre de spectres (ou une valeur négative). Ici le spectre dat_file.dat est convertie en un spectre nommé fits_file.fit.
In the example we realize the conversion of a single image (not indexed). This is why you enter 0 for the number of spectra (or a negative value). Here DAT file dat_file.dat is converted into a FITS file named fits_file.fit.Pour les experts seulement / For experts only
Voici comment ISIS (V4)
s'interface
avec l'application Gnuplot dans le détail.
Supposons que vous lancez le graphique suivant :
Here's how ISIS (V4) interface with Gnuplot application in detail.Suppose you run the following graph:
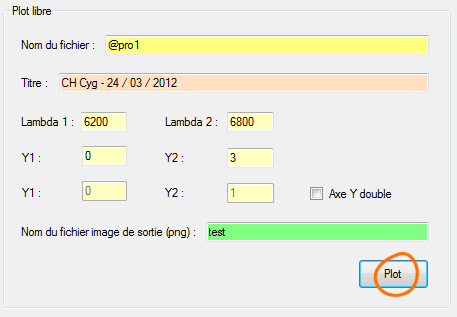
ISIS commence par convertir le fichier d'entrée au format FITS (ici @pro1.fit - c'est un exemple) en un fichier intermédiaire au format DAT ayant toujours le même nom (@.dat) et sauvegardé dans le répertoire de travail.
Ensuite, ISIS écrit dans le répertoire d'installation de gnuplot un fichier de script appellé "gnuplot.txt" (toujours le même nom), dont voici le contenu pour notre exemple :
First, ISIS converts the input FITS file (here @pro1.fit - this is an example) in an intermediate file DAT format still having the same name (@. dat) and saved in the working directory.Then ISIS written in the installation directory of gnuplot a script file called "gnuplot.txt" (always the same name), here it is the content for our example:
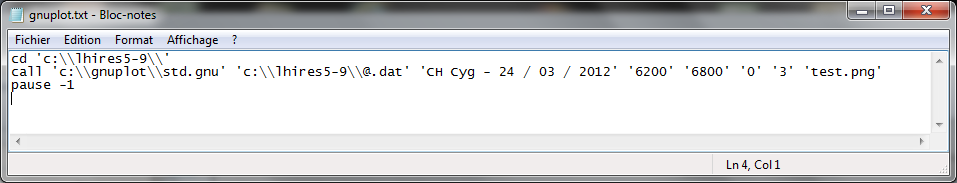
Ce fichier est envoyé comme paramètre d'entrée de l'application GNUPLOT. On y sélectionne d'abord le répertoire de travail. Ce fichier contient dans une seconde ligne les paramètres principaux du graphiques (le nom du fichier décrivant l'aspect du graphique (ici std.gnu), le nom du fichier DAT dont on veut afficher une representation graphique, le titre du graphique, les bornes en ordonnée et absisse et le nom du fichier graphique en format PNG).
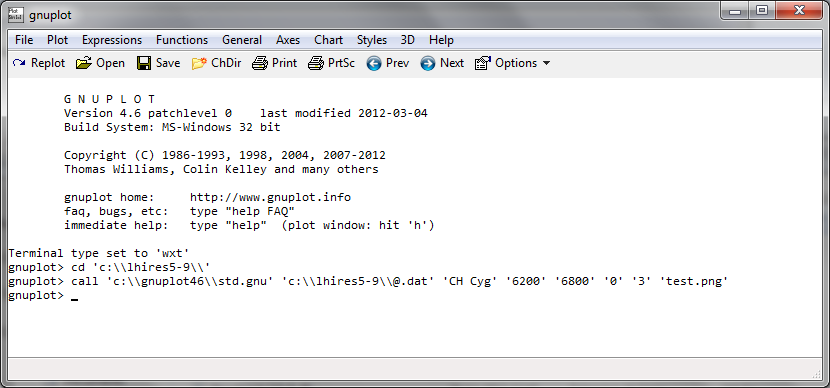
Pour mettre au point un script d'affichage qui vous est propre, il est parfaitement possible d'executer depuis l'interface même de gnuplot ces commandes, comme l'illustre l'exemple suivant :
This file is sent as an input parameter to the application GNUPLOT. It first selects the working directory. This file contains in a second line the main parameters of the graphic (the file name describing the appearance of the graph (here std.gnu), the name of the DAT file that you want to display a graphical representation, the chart title, the X and Y limits and the name of the graphics file in PNG format).To develop a script of your own display, it is perfectly possible to execute the same script from the gnuplot interface, as illustrated by the following example:
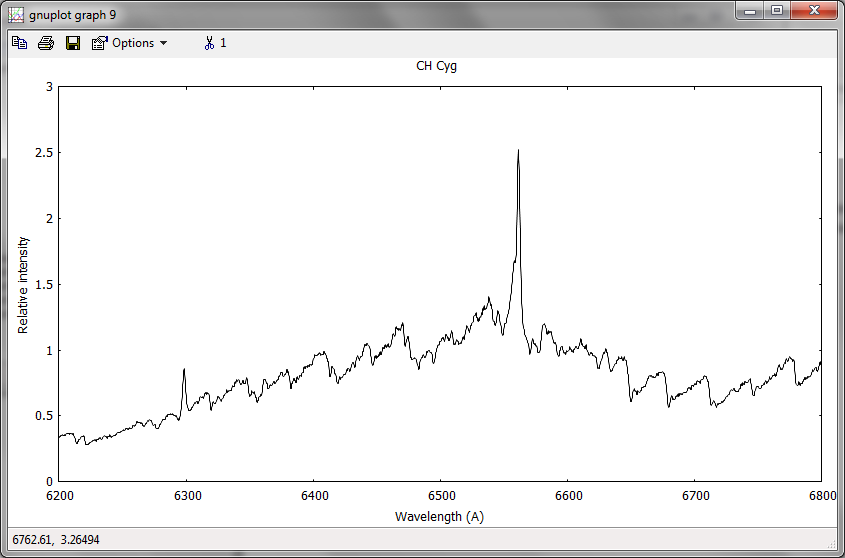
Voici le résultat typique :
Here, the typical result:
Supposons que nous fassions une erreur dans le fichier STD.GNU :
Suppose we make an error in the file STD.GNU: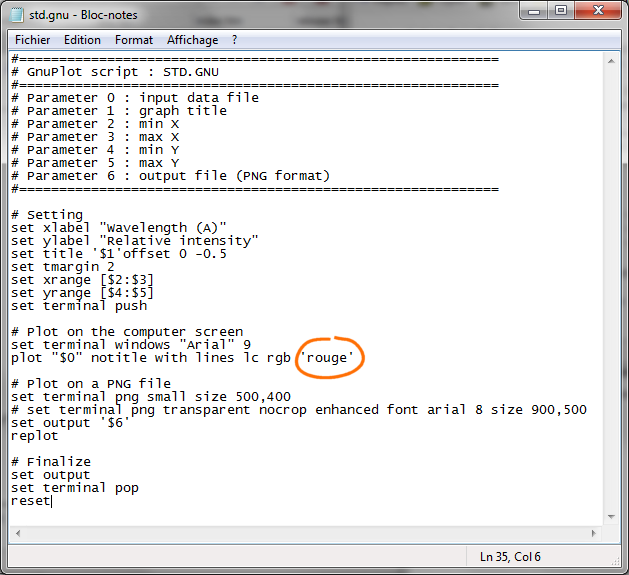
Lançons ce script depuis l'interface gnuplot :
Run this script from gnuplot interface: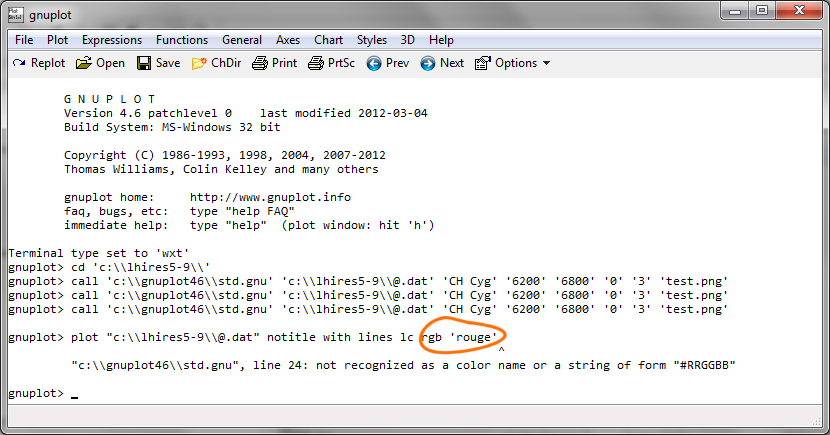
Gnuplot nous signale une erreur et nous précise sa nature. Corrigeons là :
Gnuplot we will report an error and tells us its nature. Correct here: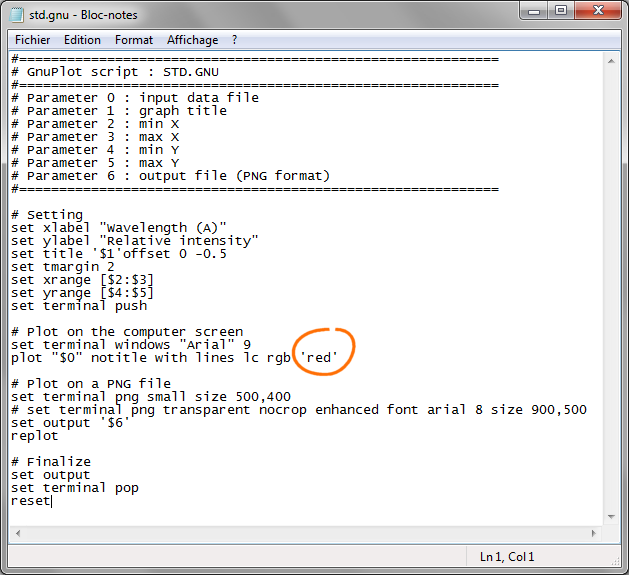
La modification est réalisée avec succès, voici le résultat :
The correction is successful! Here the result: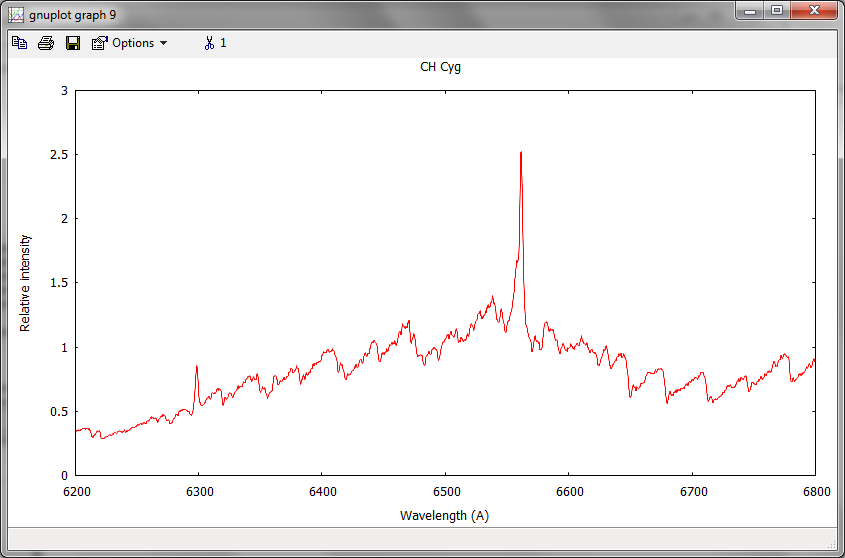
Aprés avoir fait cette modification dans le fichier STD.GNU, à présent ISIS produit des fichiers PNG ou des animations en faisant un tracé de couleur rouge.
After making this change into the file STD.GNU, ISIS now produces PNG files or animations by using a red drawing line.