English translation: Robin Leadbeater
To find the spectral dispersion equation, you can use the Balmer lines (sequence of hydrogen lines) of a type A or B star.
From the "Settings" tab, select the option:
Observe a star of spectral type A or B. Here the star HD198183, spectral type B5Ve has been used (a type A0V A5V would have been better):
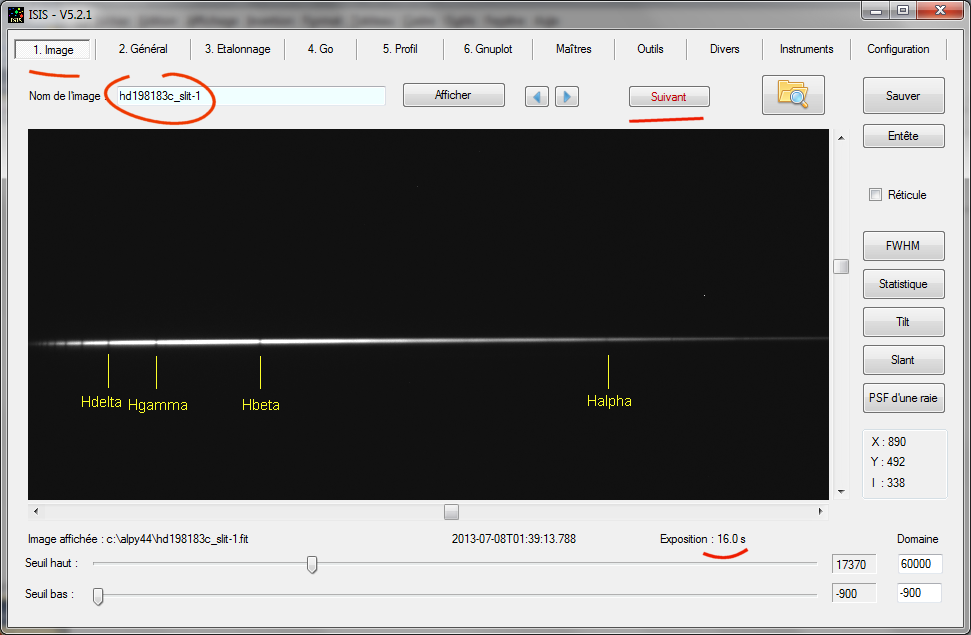
Learn to identify the Balmer lines in the raw spectrum. Click "Next."
In the "General" tab, select the calibration mode "Predefined" and "ALPY 600 (Balmer)":
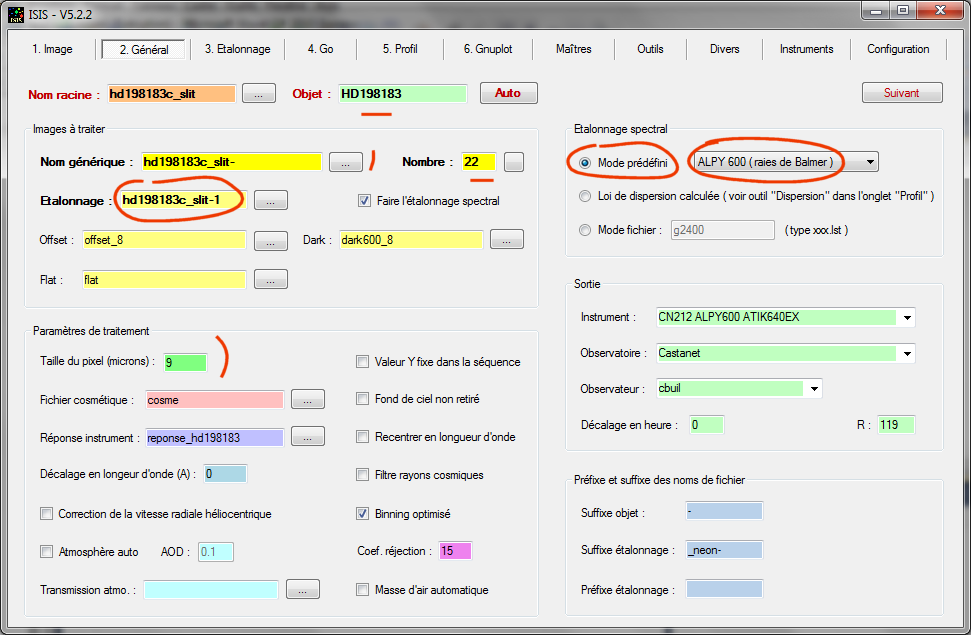
IMPORTANT: Change the file name of the calibration image. Since we are going to wavelength calibrate using the star being processed, enter the name of one of the raw star spectra (here the first of a sequence of 22 images).
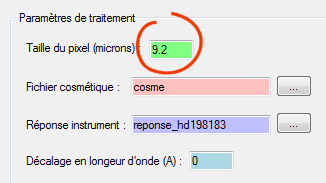
Also important, choose the good value for the pixel size. In ISIS, this parameter is just a scaling factor to automatically find the position of the Balmer lines in the images. If the ratio is not correct, ISIS can not identify the correct positions of the Balmer lines (see below).
Depending on the particular spectrograph, it is possible that you will need to adopt a slightly different size compared to the "official" pixel size of your camera. This can be due to small differences in spectrograph manufacture or the thickness of the mounting ring of the camera. In the example, I used an Atik460EX camera whose pixels are 9.08 microns when 2x2 binned (2 x 4.58 microns). I had to use here a different value: 9.00 microns.
A tip for calculate the scaling factor p (or virtual pixel size). Use the formula:
p = 3123 / dx
where dx is the distance between the H alpha and H beta lines measured in pixels along the horizontal axis in a raw image. Try to find the distance to the nearest pixel (the reading of the mouse pointer is sufficient). In the example, the H alpha line is at x = 882, while the H beta line is at x = 535. So dx = 882-534 = 347, and thus the pixel size to adopt is p = 3123/347 = 9.00 pixels.
To maximize accuracy, do the maths from an unbinned image, remembering then to multiply the value found by two if you then bin 2x2.
Fill in the Offset, Dark and Flat fields (It is really recommended that a flat-field is used with a low-resolution spectrograph - if you do not have the Alpy calibration module, you can use an external halogen lamp illuminating the entrance to the telecope through a diffuser). The instrument response file is not essential at this stage, you can leave the field blank, but be aware that the use of this response can improve the accuracy a little.
Click"Next." You are in the "Calibration" tab:
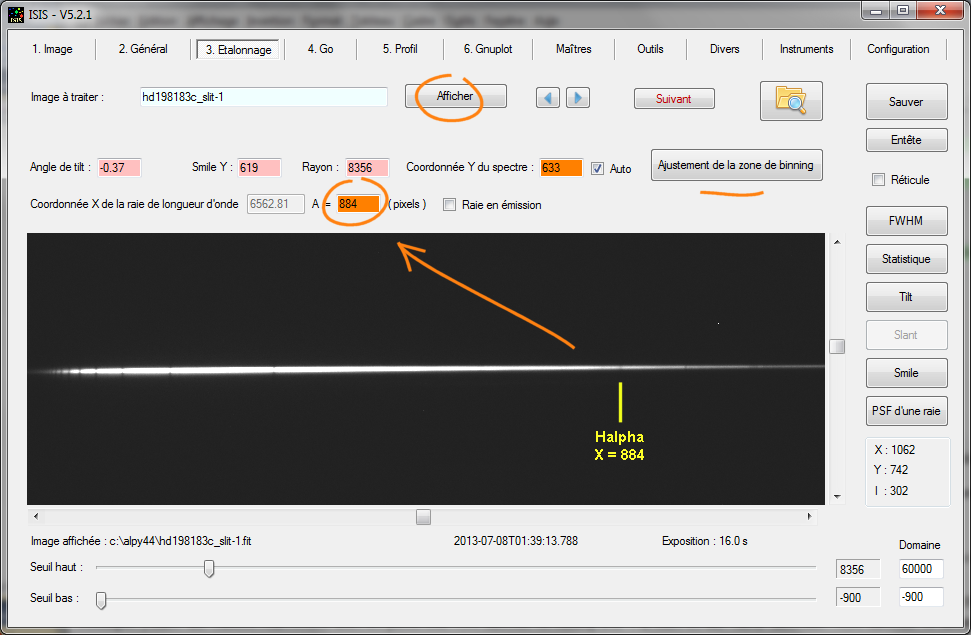
On this tab, provide the X coordinate of the H alpha line (lambda = 6562.81 A). If necessary, adjust the binning zone using the corresponding wizard:
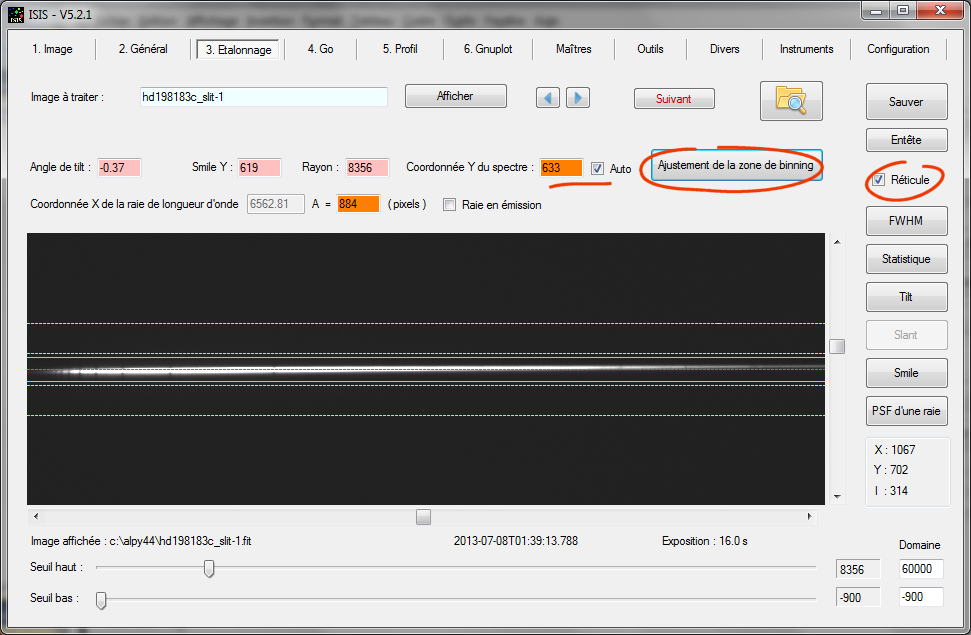
At this point, make sure the Y coordinate of the spectrum is correctly found (here Y = 633 approximately) The binning must be centered on the spectrum.
Click "Next".
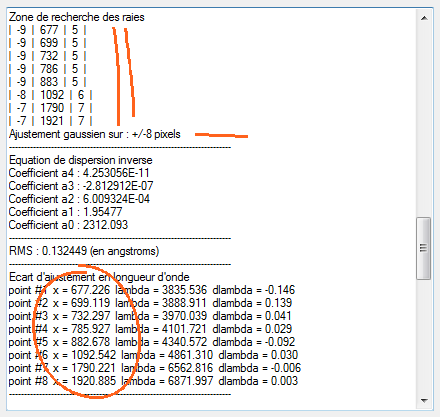
Start the processing by clicking on "Go":
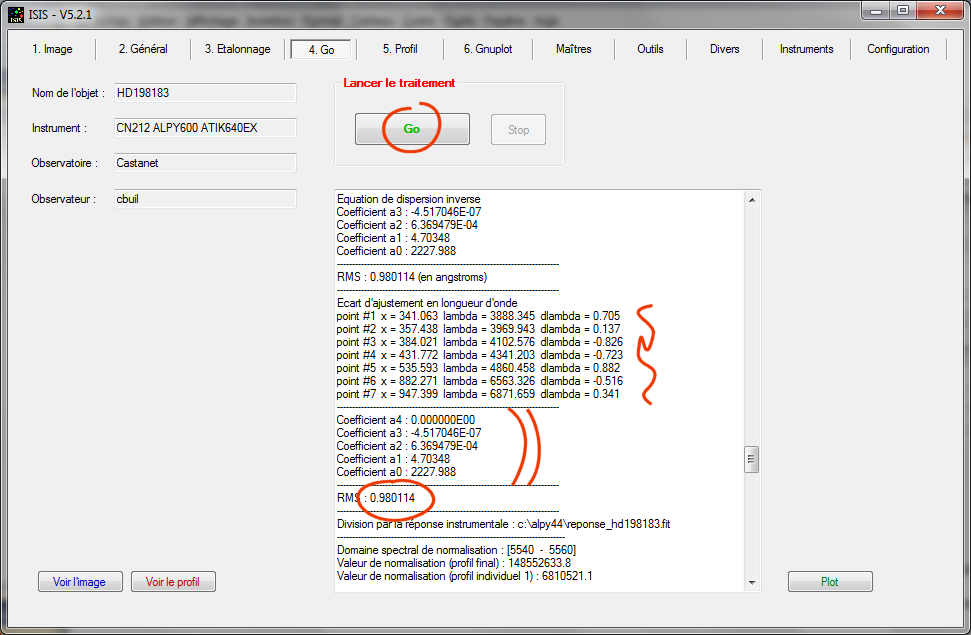
Note the coefficients of the dispersion polynomial equation (here ISIS has fitted a polynomial of degree 3). Above all, look at the value of the RMS error in Angstroms. This is a measure of the calibration error. Here it is 0.98 A, which is quite good considering the method. It is only if the value is greater than 2 or 3 A need that you need to worry - see below ...
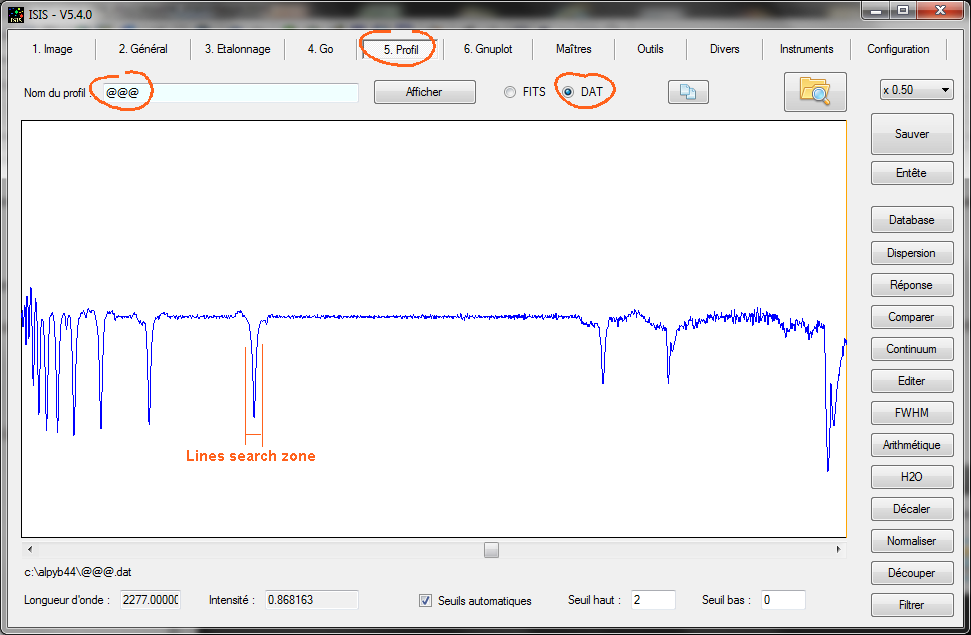
You can view the profile by clicking the "Profile" button:
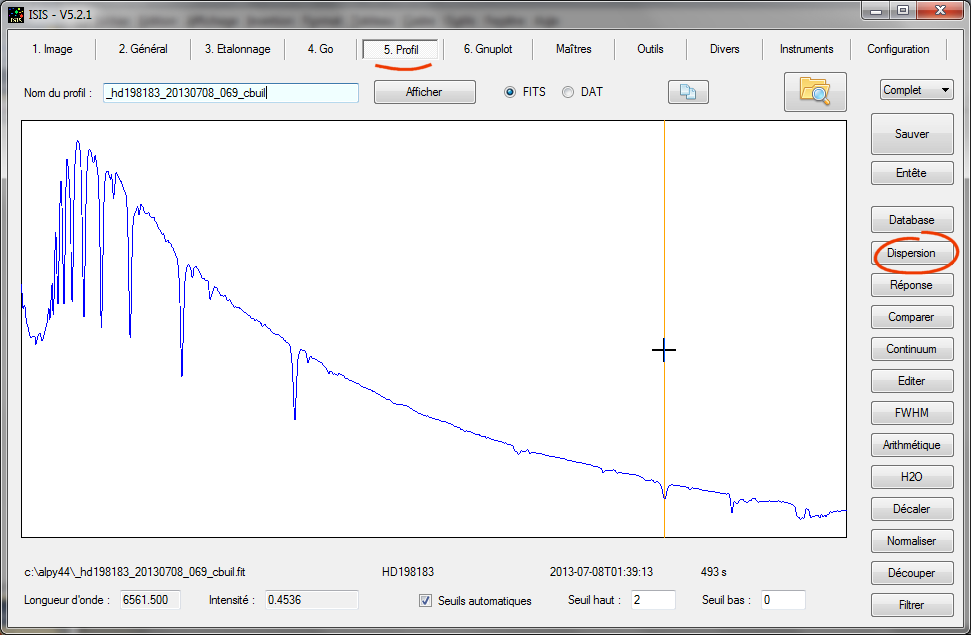
The spectrum is calibrated, the processing is complete.
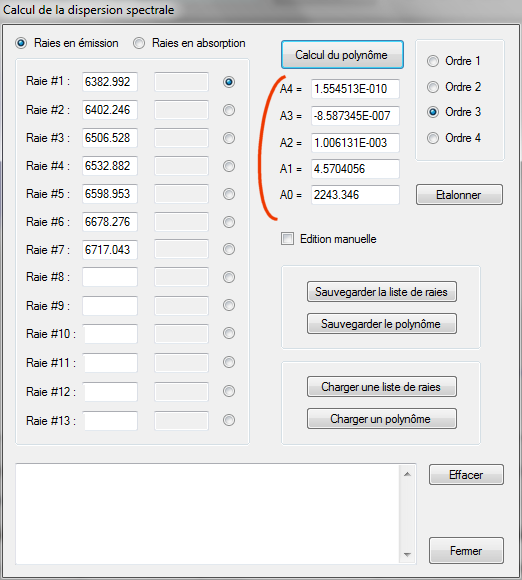
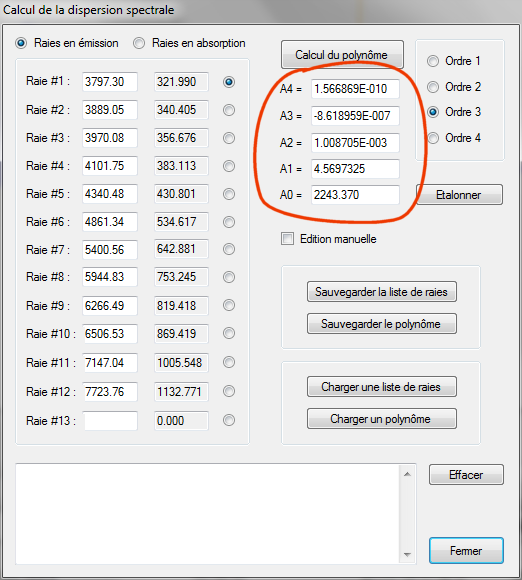
Out of curiosity, click on the "Dispersion" button. It is here that ISIS saves the calculated calibration coefficients. It is here that ISIS will systematically look for the coefficients for subsequent processing (you can save these coefficients, reload, change manually ...):
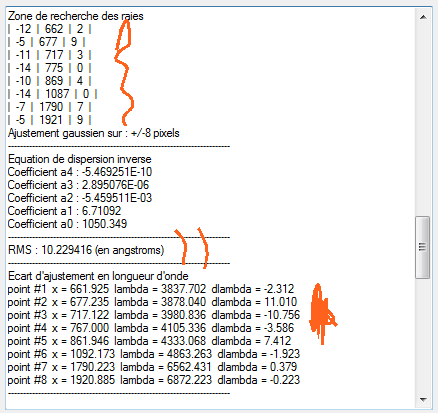
If you mess up on the scale factor (or the coordinate of the Halpha line) IRIS defined an erroneous zones and can not find the Balmer lines. The result is a spectral calibration error (with a very high RMS value).
Suppose that an incorrect value is used for the pixel size. For example p = 9.2 microns instead of p = 9.0 microns:
We find some thing like:
If you want to understand how ISIS proceeds to find the exact position of the Balmer lines, view the "@ @ @ dat" file after processing (from the "Configuration" do not clear intermediate files):
Now, how do we use the calibration results to process other stars?
We will process a sequence of the star Vega (Vega-1, ...., vega-22) using the coefficients which have just been found from the guinea pig star HD198183. There are two techniques which can be used.Technique 1
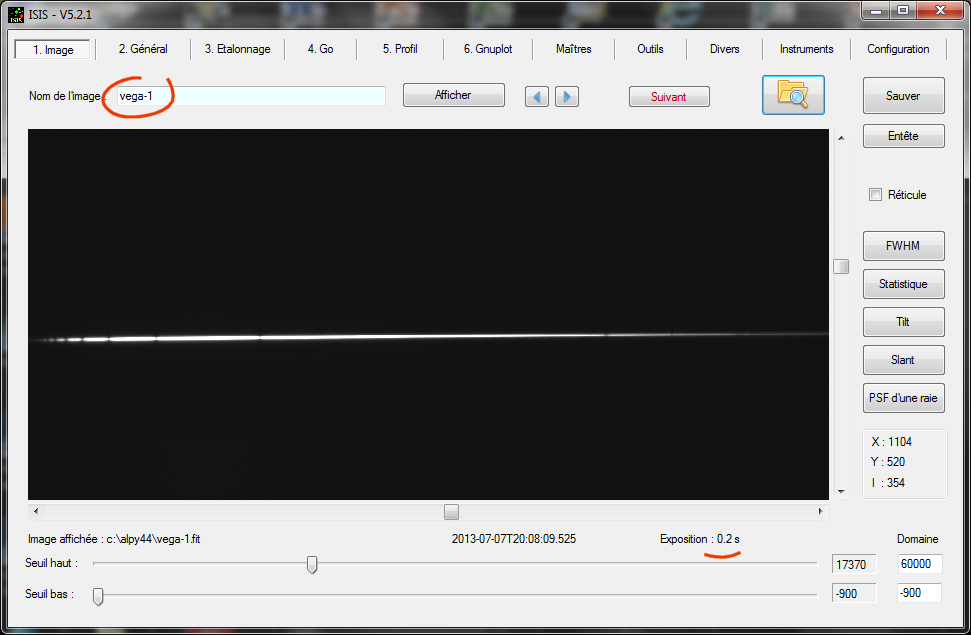
Here is a look at the first image of the sequence to be processed (note in passing the very short exposure time):
Here is how to set the "General" tab:
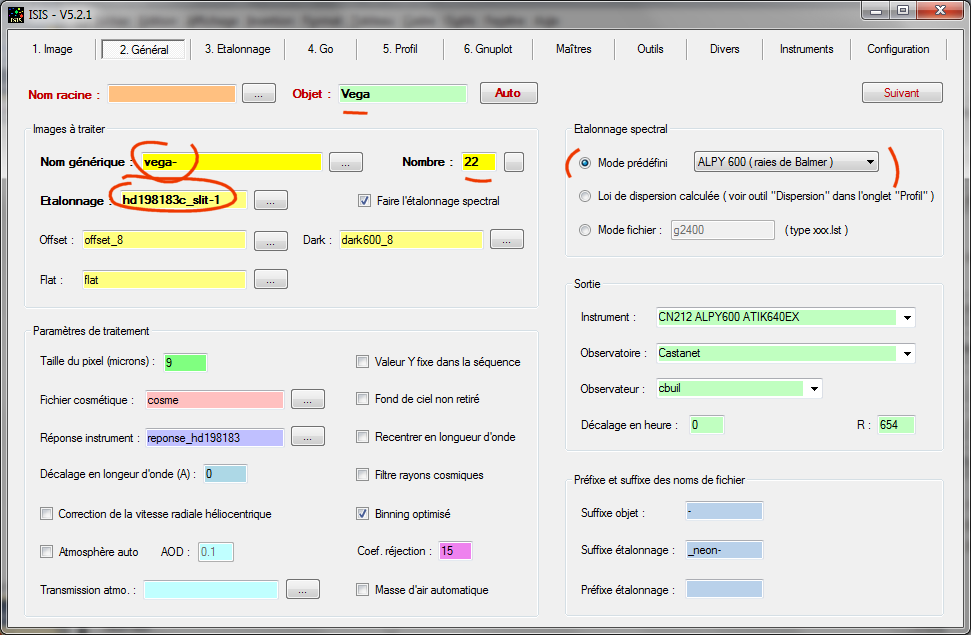
The generic name has been changed, but note however that the same reference image is still used to calibrate the spectra. So almost nothing is changed.
You can go directly to the "Go" tab, and then click "Go". ISIS recalculates the calibration equation using HD198183c_slit-1. As expected, the same coefficients for the calibration equation are found. The calculation is fast, you do not even see it. The spectrum of Vega is processed.
Technique 2
The calibration equation is used without recalculation. Select this in the "General" tab so:
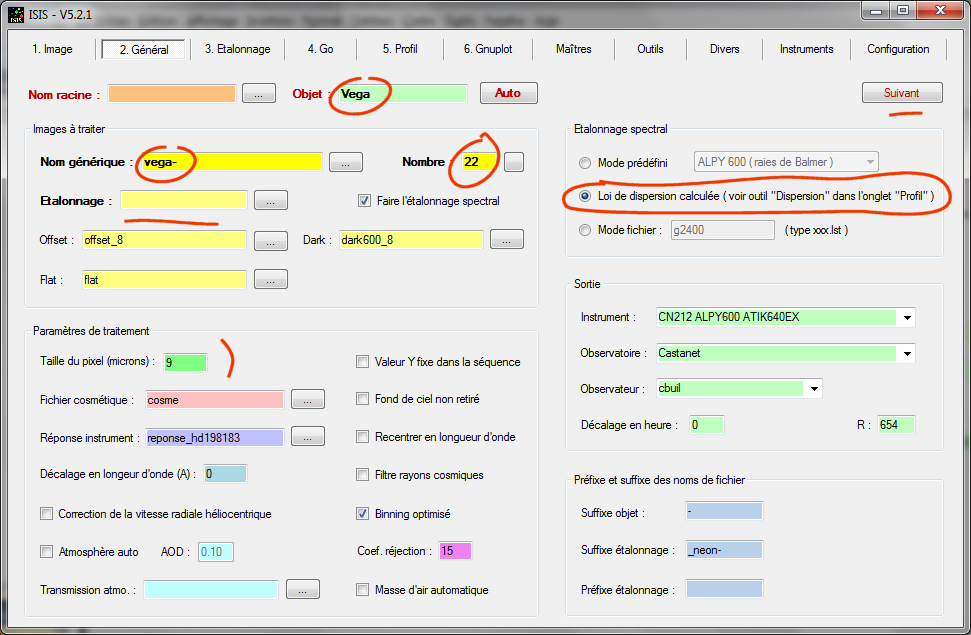
First select the "Calculated dispersion equation" option. You can delete the contents of the calibration file (not required, the name of a calibration reference image is not needed since the coefficient is not recalculated.).
Click "Next":
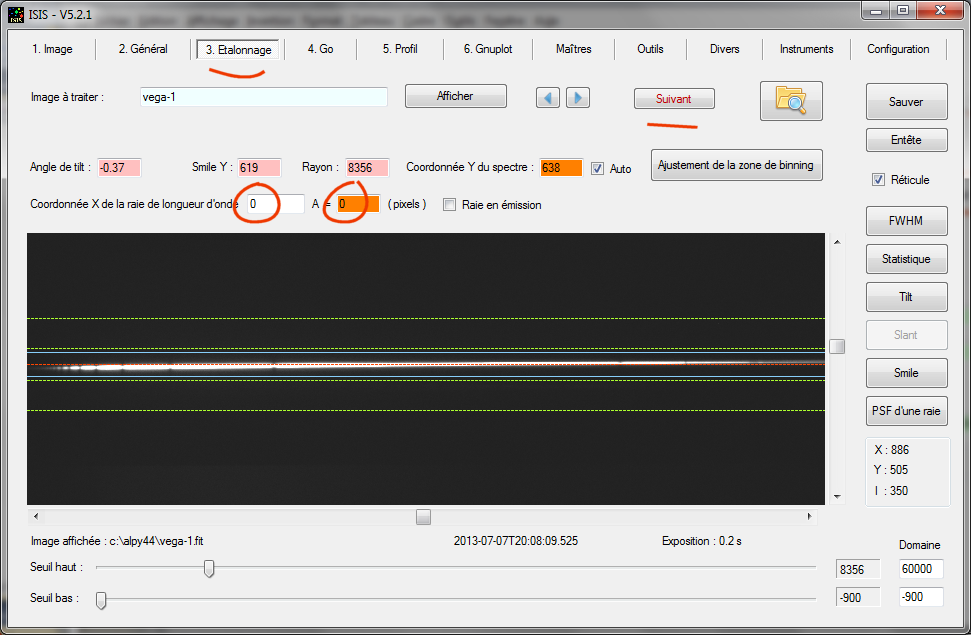
Reset the fields indicated to zero. This is a trick to tell ISIS not to calculate a new calibration polynomial. Go to "Go", and it is finished, the spectrum of Vega is processed. You can sequentially process at high speed, the spectra of all the nights objects.
METHOD 2: If you have the Alpy calibration module, you can calibrate just using the Ar Ne lamp
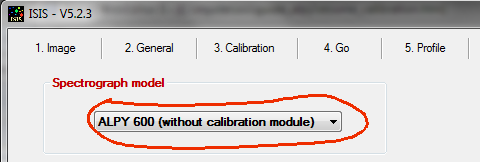
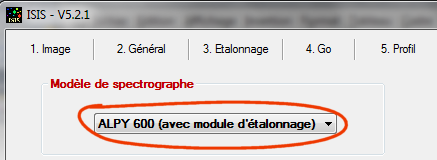
In the "Configuration" tab, choose the spectrograph model:
In the "General" tab:
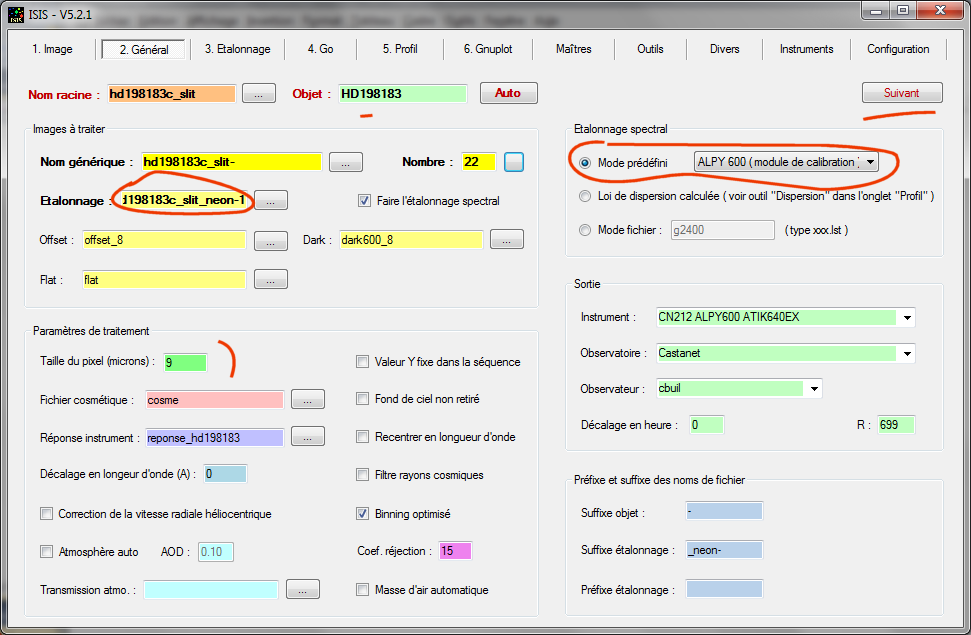
Note that we supply the name of a standard calibration image with a spectrum of emission lines. It is a spectral image of the Ar Ne lamp in the Alpy calibration module (which must be well exposed, say 30 to 60 seconds typically).
VERY IMPORTANT: you must select the calibration mode "ALPY 600 (calibration module)" in "Settings" tab.
Now select the "Calibration" tab:
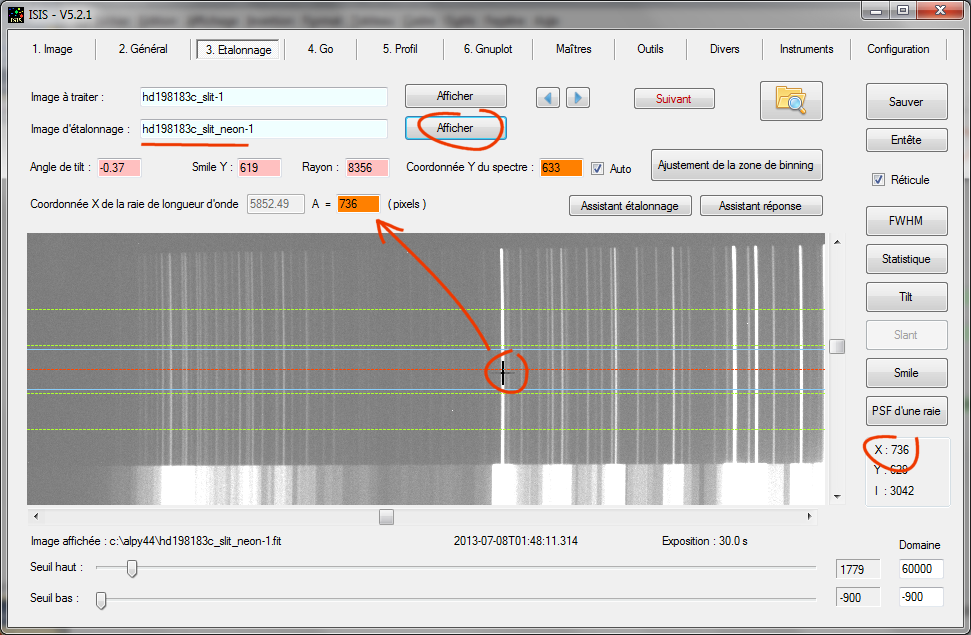
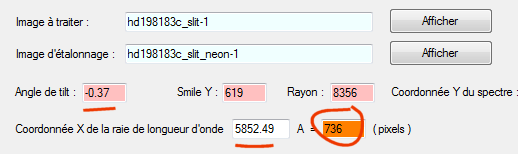
Estimate the X coordinate of the Ne line at 5852 A (Use the mouse and the image above to correctly identify the line). Here we find X = 736. You have a tolerance of + / -5 pixels on this value. Complete the indicated field.
Start processing from the "Go" tab ... and it's over!
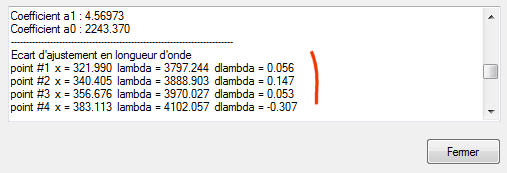
Here are the calibration errors found by this method (ie, using only the Ar Ne lamp):
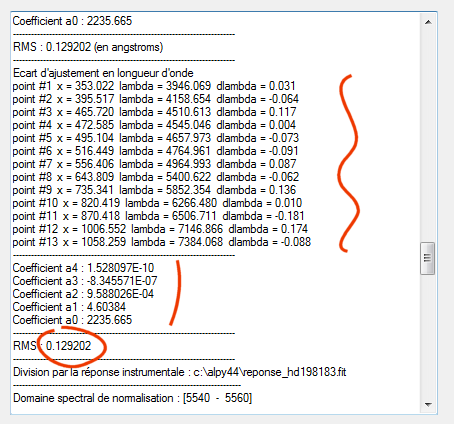
The residual errors are very low, of the order of 0.1 A (!). Considering that the average sample here is about 4.8 A per pixel, this means that it has the potential to calibrate to better than 0.02 pixel (that is an error in the radial velocity of just 5 km / s). Note that ISIS uses a series of 13 lines for calibration (the residual dlambda is given for each line in angstroms, which helps to diagnose nanomalies).
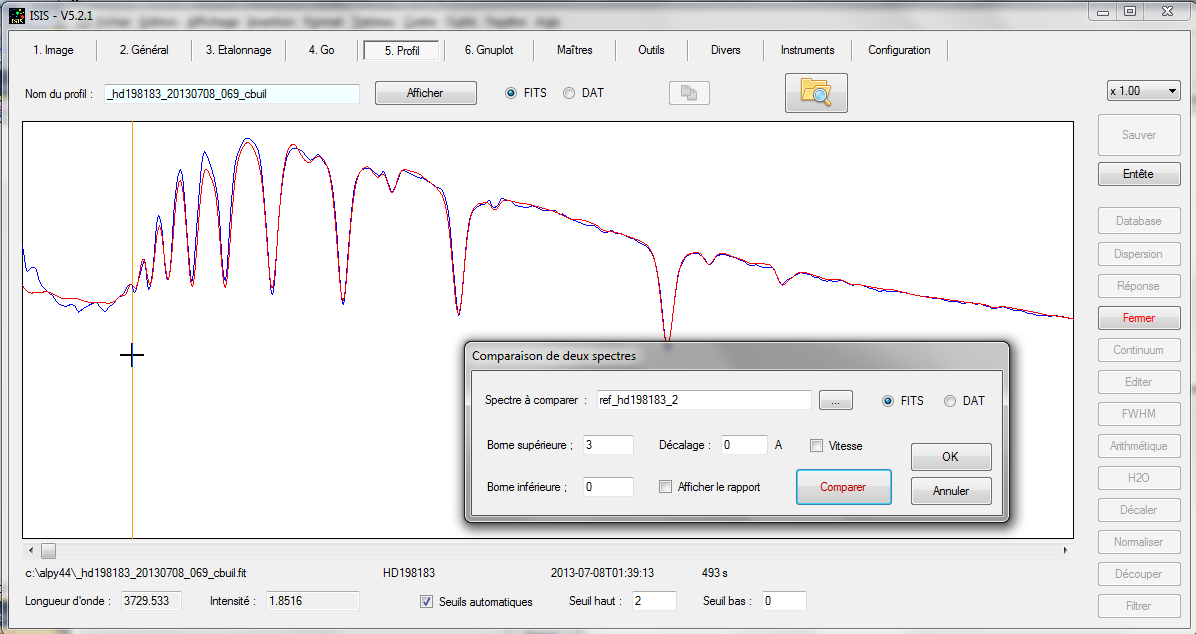
The comparison between the observed spectrum of HD198183 (blue) and the reference spectrum for the same star from the MILES database (red) is instructive:
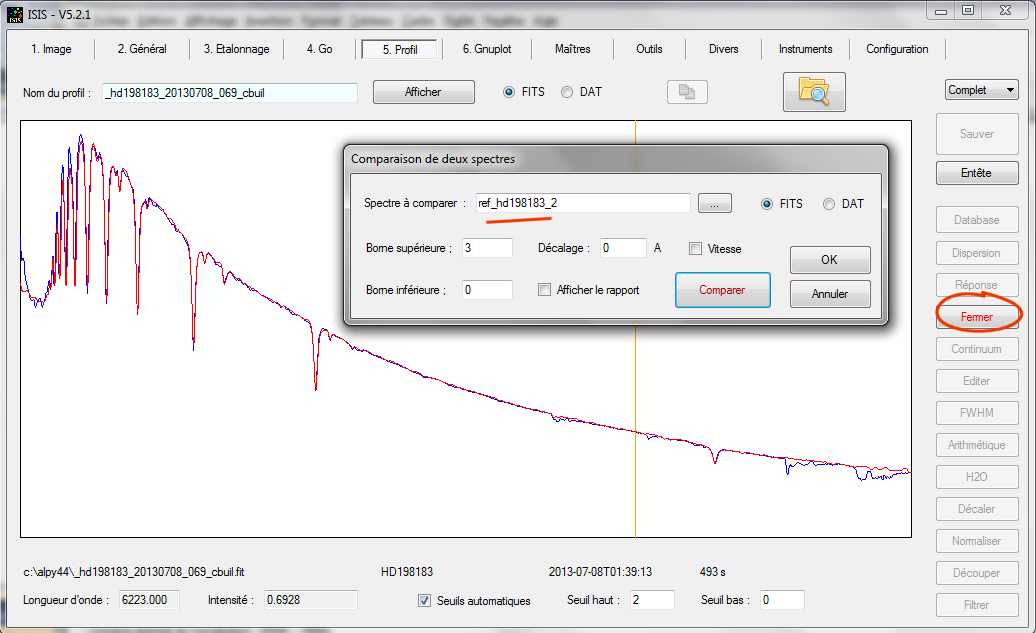
Note that the MILES spectra were smoothed with the "Filter" tool to match the resolution of the Alpy 600 spectrograph. The agreement is very good over most of the spectral range. But look closer, things diverge in the ultraviolet:
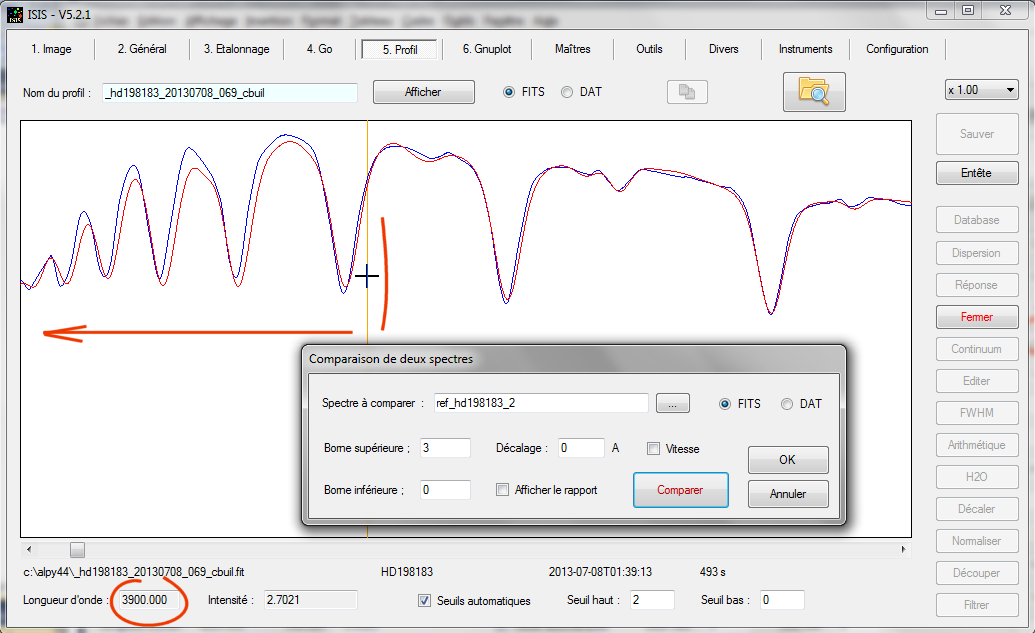
For wavelengths shorter than 3900 A, calibration becomes less accurate. The reason is that the furthest line used in the Ar Ne lamp spectrum is located at 3946 A. For shorter wavelengths, ISIS therefore extrapolates the polynomial, which is never as good. The ArNe lamp (RELCO model) is not yet powerful enough to calibrate the entire acquired spectrum (Alpy 600 certainly pushes the boundaries in the ultraviolet).
CAUTION: it is in this mode that the scale "pixel" factor must be the best fit. In this example, if the value is changed from 8.92 microns to 9.08 microns or greater (the physical value of the detector), the algorithm fails. Here for example is the calibration result if I use a pixel size of 9.08 microns:
Change the value, click Go and judge the result. It can be done quickly and it's only done once, upon receipt of the spectrograph and after assembling your camera.
METHOD 3: Mixed method: star + ArNe lamp
A type A or B star is used to calibrate the blue and ultraviolet part of the spectrum. The Ar Ne lamp is used to calibrate the red part. The two methods are married together.
First, from the "Configuration" tab, choose the option:

How to configure the "General" tab:
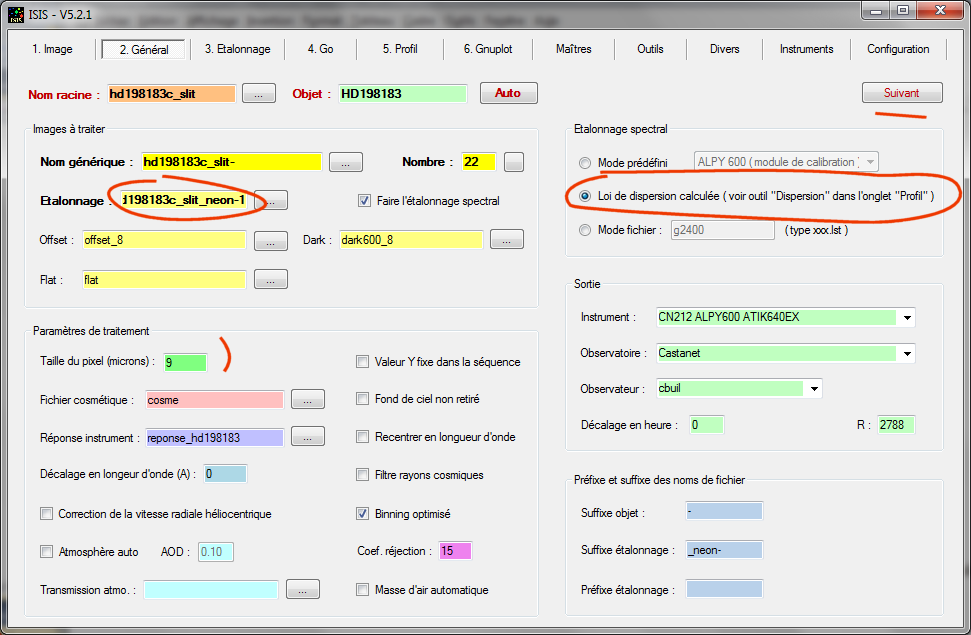
There are no particular difficulties. enter the name of the calibration file (the observed spectrum of the Ar Ne lamp). Select the "calculated dispersion." calibration mode. We will calculate the equation with a specific calibration wizard.
Click "Next."
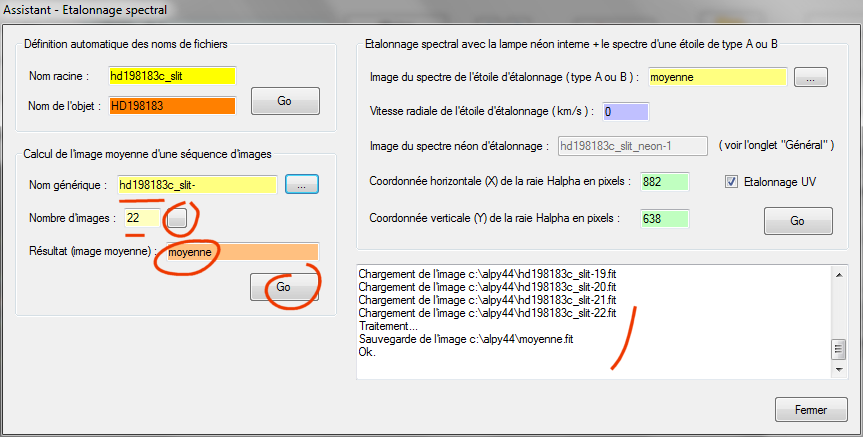
Then click the "Calibration Wizard" button. In the dialog box that opens, I recommend first calculating an average of all the raw spectrum images of HD198183 (even if you only have two or three raw spectra to average):
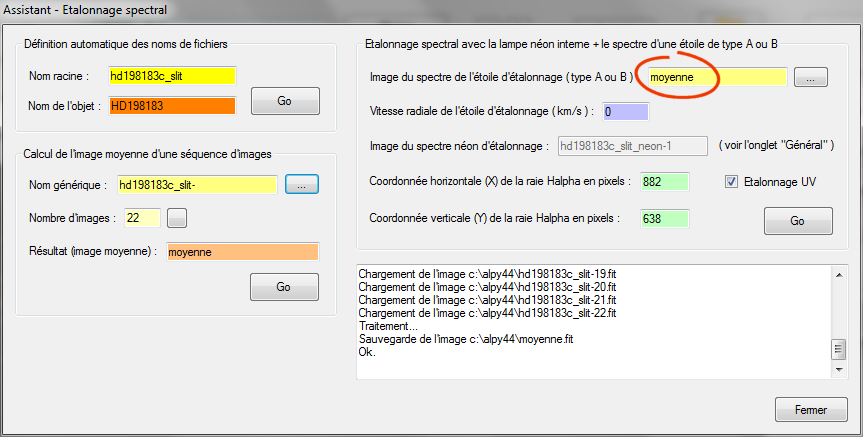
Enter the name of the average image in the "Image of the calibration star spectrum":
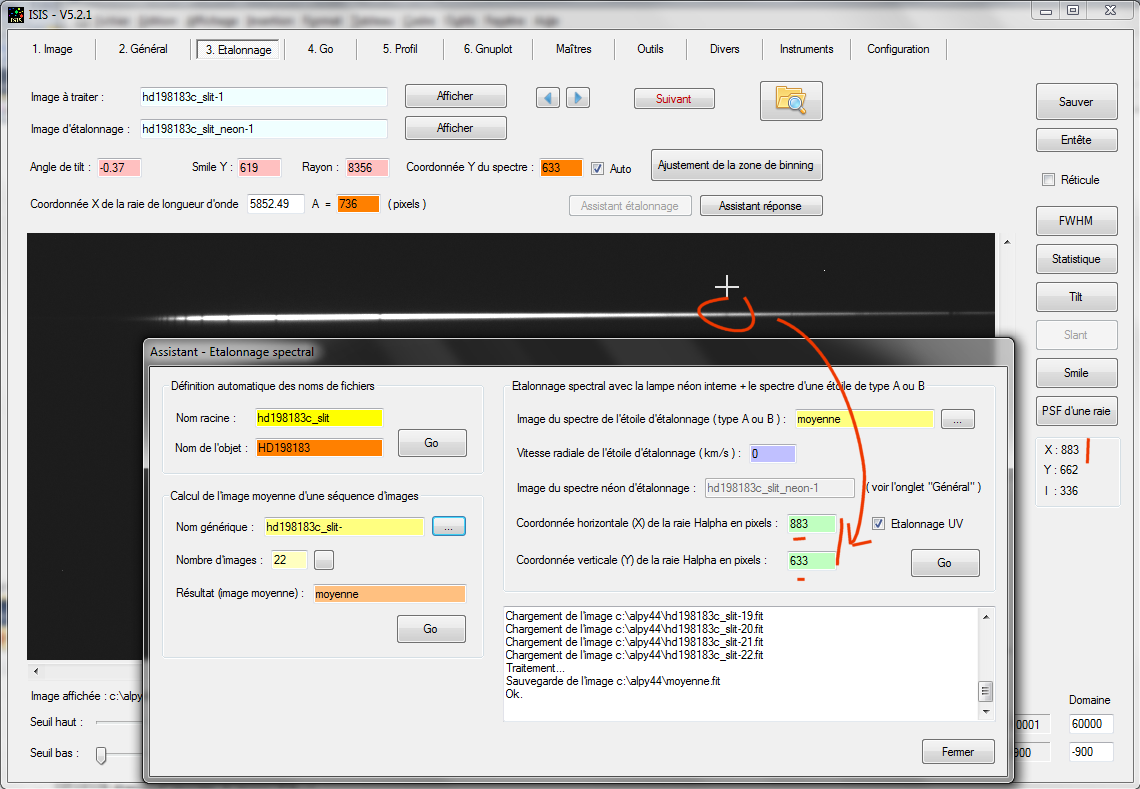
Then enter the X and Y coordinates of the H alpha line. Tip: you can double click on the image at Halpha, and the fields are filled automatically:
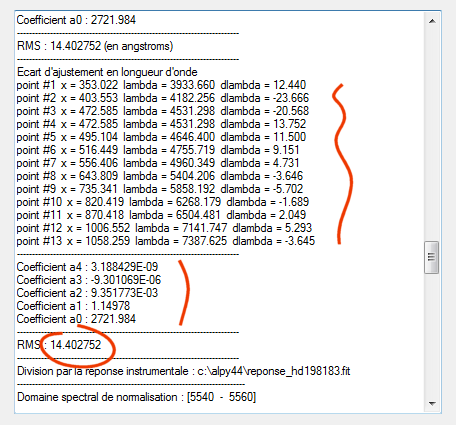
Now click on the "Go" button in the wizard box. ISIS calculates the calibration polynomial (order 4):
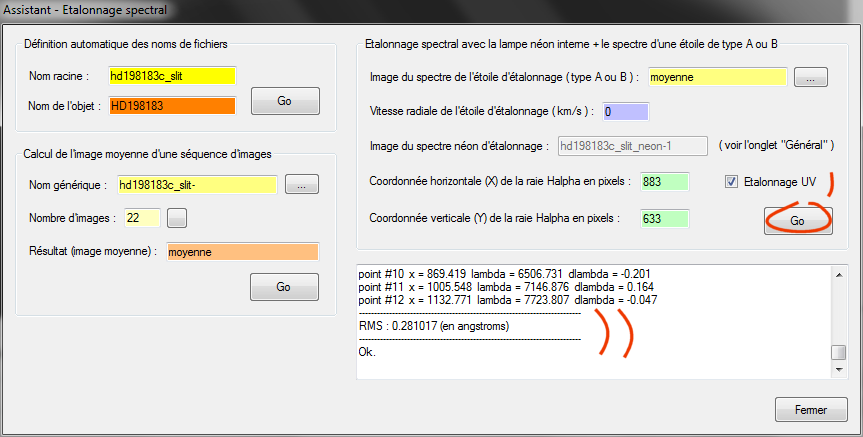
The residual error is only 0.28 A. This is a very good result. You will often find an RMS 0.5 to 0.7 A. Do not panic, this is still a good result. Everything depends on the signal-to-noise of the spectrum of the calibration star and the contrast and sharpness of the Balmer lines.
We selected "UV Calibration" and therefore ISIS uses here the very blue lines of the Balmer series to calibrate the ultraviolet part of the spectrum option:
Close the Calibration Wizard window.
Note that the wizard assesses the angle of tilt of the spectrum and automatically finds the X coordinate of the neon line at 5852 A for you. You do not even have to fill in these fields:
Go to the "Go" tab, then "Go". Here is the result in blue:
The spectrum is properly calibrated to 3730 A, which is very powerful. This can only be achieved through an understanding the inner workings of ISIS, experimentation and developing good reference images (the tool will only work if you have a good subject, and very good material!). The performance of the Alpy 600 in the UV is remarkable (especially if you use an achromatic telescope without a focal reducer). As always, you can find the calibration coefficients in this dialog ... this is your treasure:
At this point, if I want to process the spectra of a new star, nothing is more simple. Normally you have acquired a spectral image of the calibration ArNe lamp at the end or beginning of the observation of each object. In this case, in "Calibration in the "General" tab, enter the name of the corresponding raw image. Check the limits through the "Calibration" tab and that the Y coordinate of the spectrum is correct (hint: If the checkbox "Auto "is enabled, as soon as you select this tab, the Y coordinate is automatically updated). Then start processing directly from the "Go" tab. Everything is automatic. If there is no calibration image associated with the object, enter the name of the calibration acquired nearest in time and at the closest angle in the sky.