LIQUID
SPECTROSCOPY
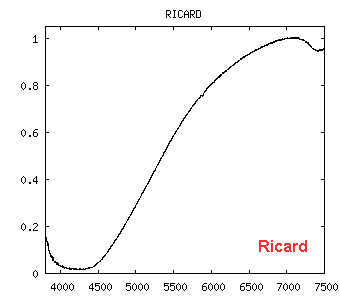
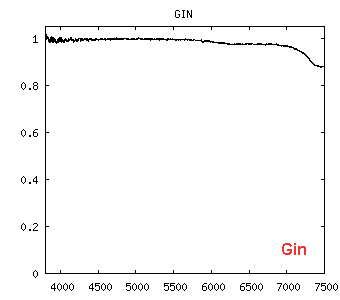
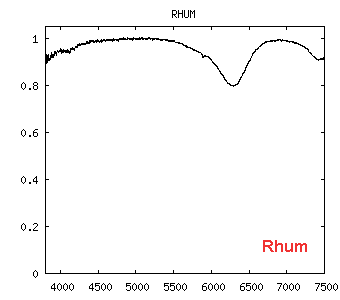
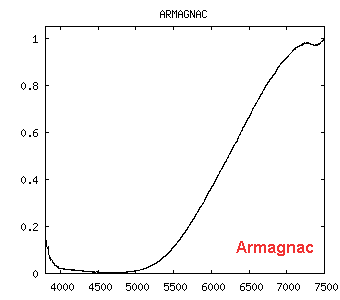
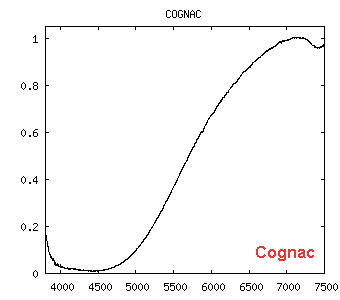
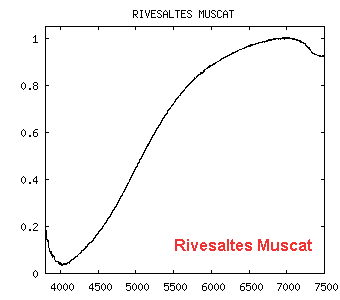
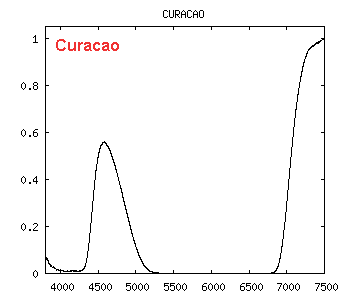
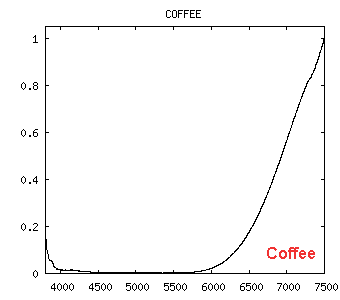
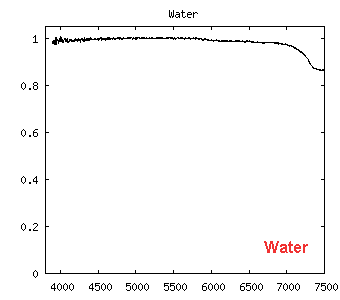
Spectra
of some substances and light sources
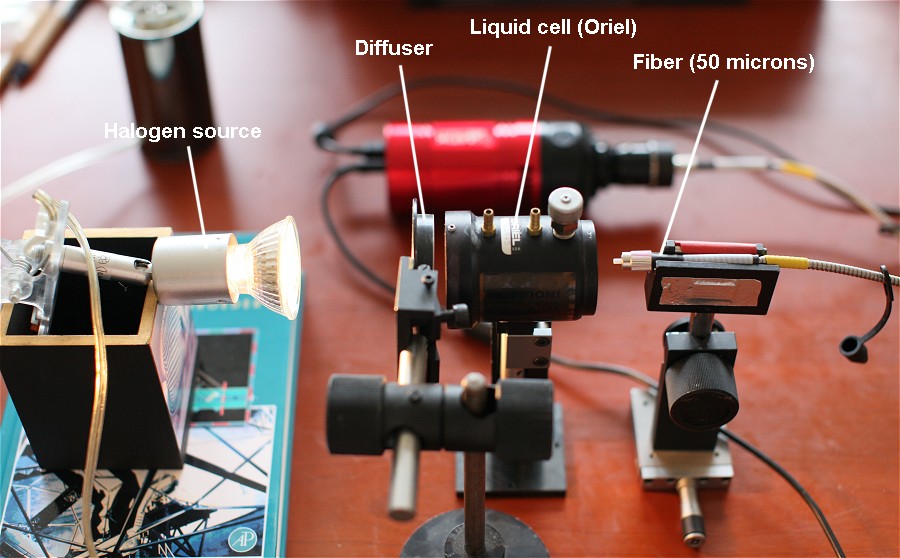
Experimental
configution.
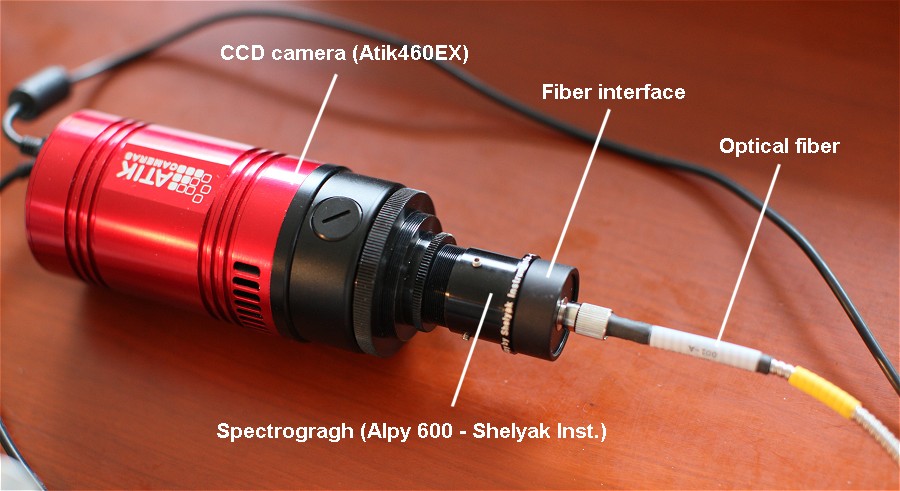
The
spectrograph is an Alpy
600 model linked to a multimode
50 microns optical fiber. The resulting resolution power is R =
300.
The relative substance
absorbance (A) is given by the equation: 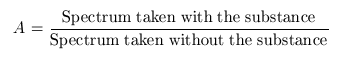
Wavelength
are in Ansgtoms
|
|
|
|
|
|
|
|
|
|
|
|
|
|
|
|
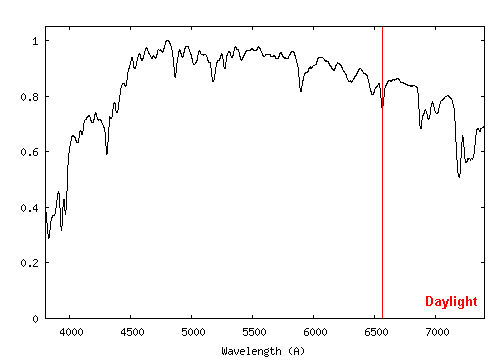
Some light source (measured on a commun white screen - the daylight is the reference)
|
|
|
|
|
|
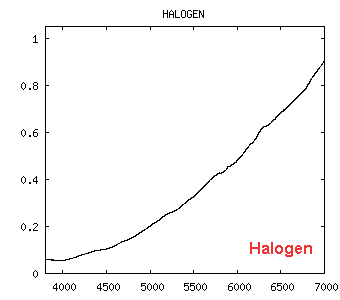
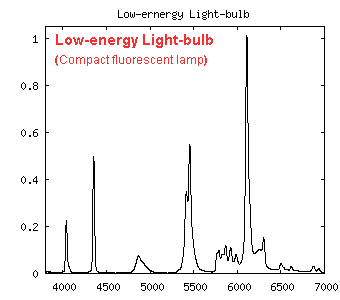
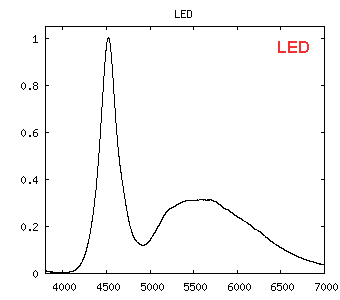
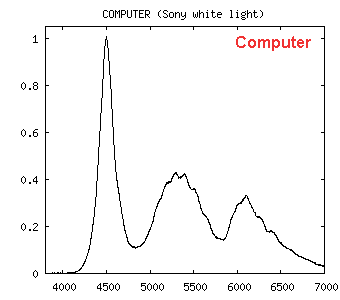
Note: LED lamps are the
future of urban lighting !? It is equivalent to a permanent
exposition to a white computer screen....
It is not a very
excellent new for your eyes and astronomical electronic detectors.
The
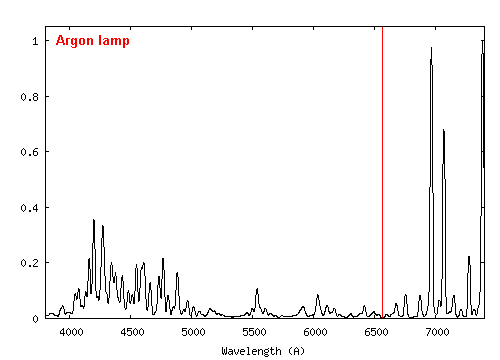
red vertical line in the plots indicate hydrogen Halpha line position.
The argon lamp (Filly model) is used for spectral calibration.
Application
to optical filter transmission measure
The
setup is similar (50 microns fiber, Alpy 600 spectral resolution
reduced to R = 300),
but the optical beam is collimated at filter
level for supress spectral shift effect (caused rays tilt in
an interference filter)
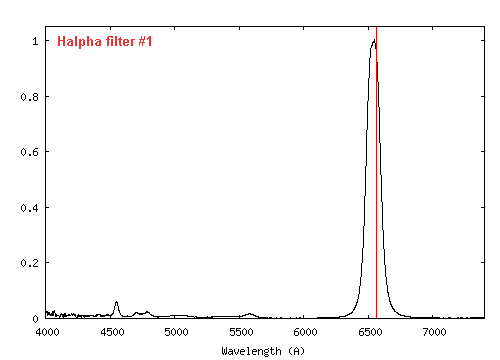
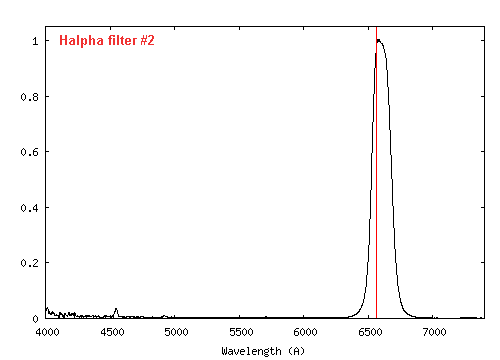
Optical
transmission measure of two standard Halpha hydrogen filters. The central wavelength of each filter is significantly shifted with respect to the theoretical Halpha
wavelength (red
vertical line). This is a common problem, unfortunately!
For the filter #1, the measured FWHM is 11 nm (specified to 13 nm),
but the central wavelength transmission is at 654.0 nm (Halpha line
wavelength is 656.3 nm).
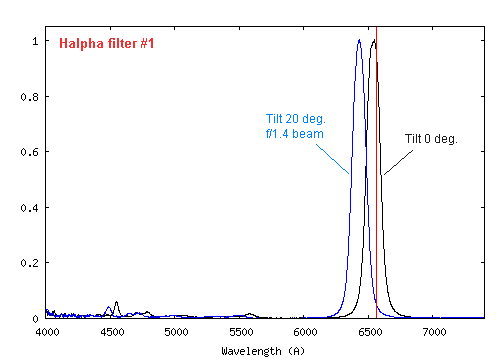
The problem is more critical for filter #1, because in a converging beam of rays, the central wavelength is more blue-shifted.