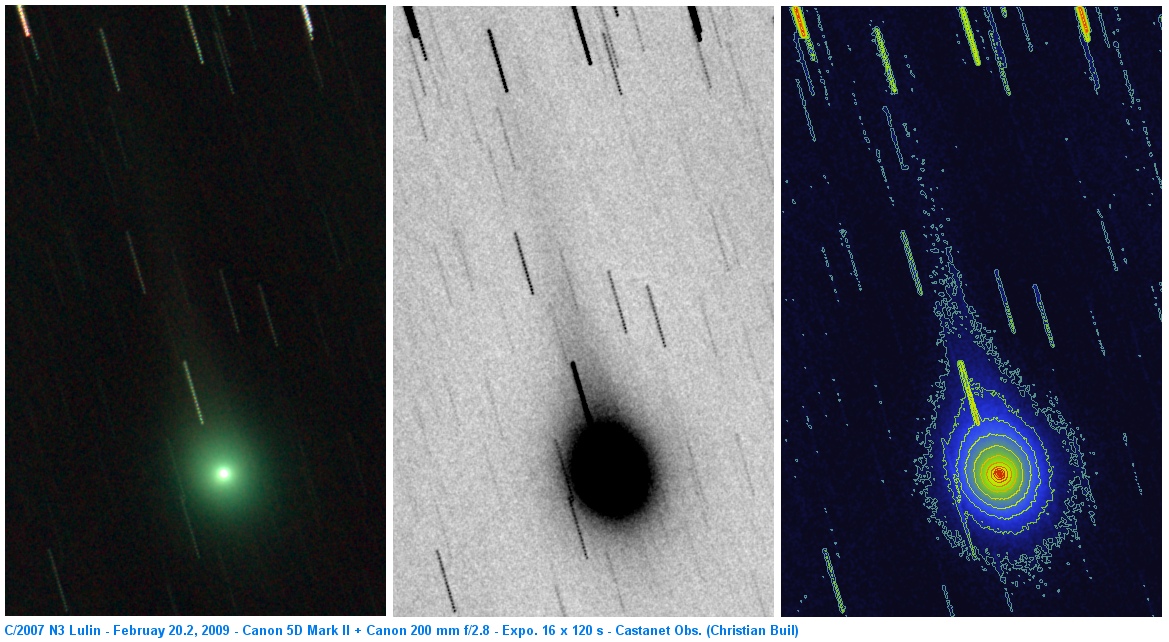
Comet C/2007 N3 Lulin
February 20, 2009 observation
Images of C/2007 N3 Lulin on February 20.2, 2009 (Digital SRL camera Canon 5D Mark II + Canon 200 mm f/2.8, 12 x 2 mn @ ISO200 - Severe suburban sky pollution) :

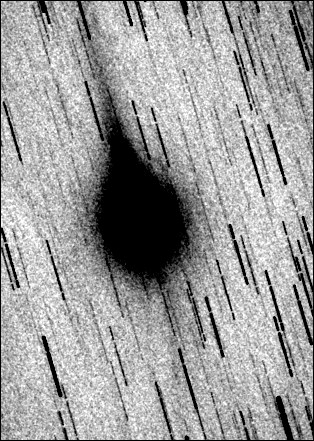
The gaz antitail is only faintly visible for the date (down of the coma).
Sum of separate 32 x 120-second exposures with a standard Canon 5D Mark II.
The blue sensitivity of an unmodified DSRL is very poor - see here for example, so the access to CN spectral line is virtually impossible.
Below, spectrum of C/2007 N3 Lulin + background sky taken the February 20.2 2009 with a Lhires III (150 g/mm) spectrograph attached to a Celestron 11 telescope. The camera is a QSI-532 (CCD Kodak KAF-3200ME). Exposure duration : 5 x 15 min (binning 2x2). Slit wide : 23 microns. Mean spectral dispersion : 4.5 A/pixel (estimated resolution power R=600 @ 5000 A) :
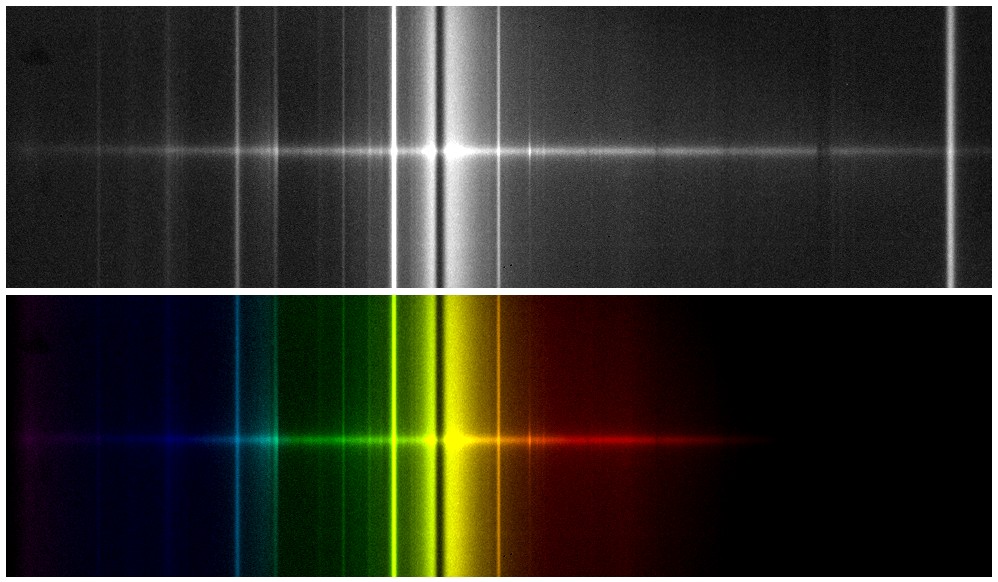
Up, black and white 2D spectrum after preprocessing. Down, the same document artificially colored with natural visible colors. Note the presence of an intense high pressure sodium lamp pollution. The comet spectra's is the faint horizontal line at the center.
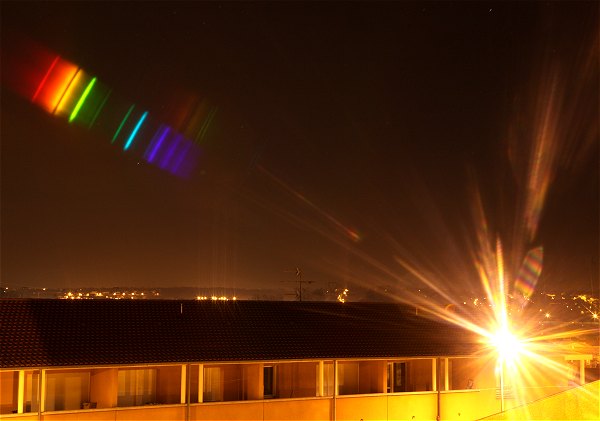
The sky pollution of my observatory (Castanet-Tolosan, near Toulouse city, south of France). Image taken with a CD-ROM installed front of the objective lens (Canon 5D Mark II + zoom at 70 mm focal length). Of course, the the CD aluminium coating is removed (an easy operation). The setup is equivalent to a (very low efficiency) 1.6 groove/mm grating. Note the typical spectrum of a high pressure sodium lamp at the upper-left corner.
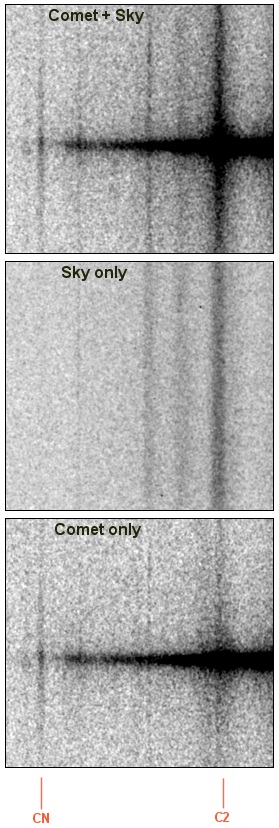
Two set of spectra are taken, one for the visible part and one for the UV part. The spectrograph is refocused in fonction of spectral region observed. Here, the technique used for extract the CN (cyanogen) line in UV (3880 angstroms) and remove the sky contribution.
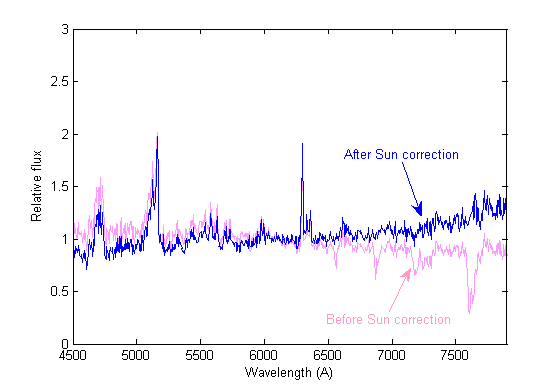
The data are corrected of the solar signature and atmospheric transmission by the observation of a solar similar star (HD126053).
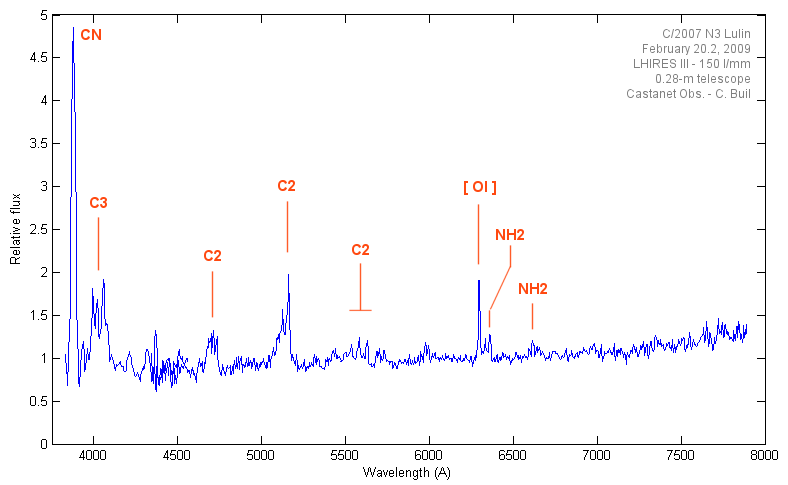
The final C/2007 N3 Lulin spectrum. Because the binning zone include the nucleus region and a small part of coma,
the plot is mixture of nucleus and coma spectra.
February 22, 2009 observation
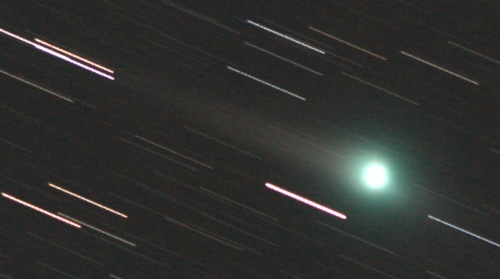
Image taken the February 22.0 2009 by using a Canon 5D Mark II and a 200 mm telelens during spectral acquisition (see below).
The image is guided on the point like nucleus with the guiding camera of Lhires III spectrograph. 18 x 4 min. exposure.
The processing stage (the original B&W images are artificially colored)

Stack of 9 x 15 min. preprocessed exposure of the cometary field (the image contain comet + sky).

Stack of 9 x 15 min. preprocessed exposure of the sky far to the cometary field (the image contain sky only).

Result of the substraction of (comet + sky) image and (sky) image (the image contain the comet spectrum).
The Swan bands are now clearly visible.

The tungstein lamp flat-field used (the oscillations are the result of the quantum efficiency variation for the KAF-3200ME CCD).

Division by the tungstein flat-field and geometric distorsion correction. The blue is artificially amplified because the low intensity of the flat-field in this spectral region.

Extraction of the coma spectral signature (addition along vertical direction - the nuclear region is excluded).

Spectrum of nucleus region only (the coma contribution is substracted).
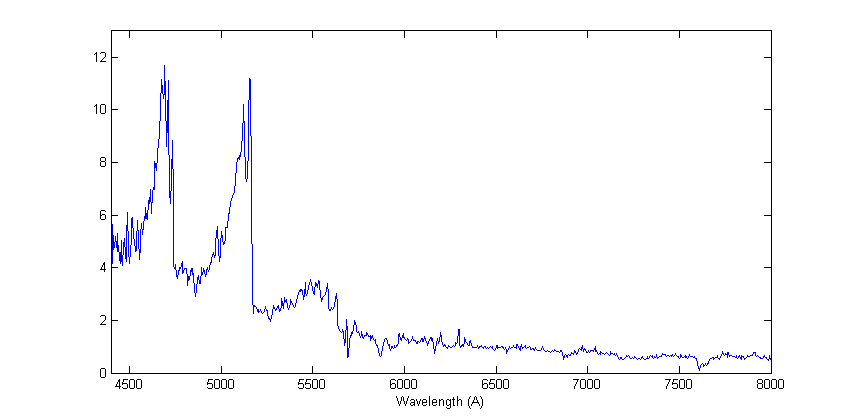
Spectral profile of coma region extracted from the 2D image.
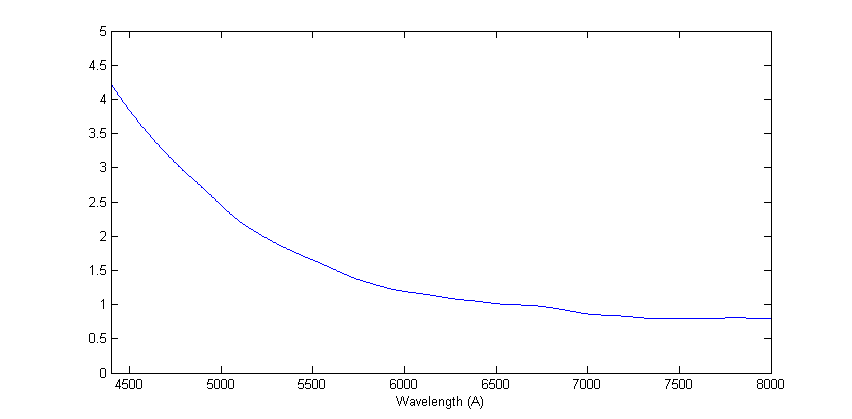
The adopted calibration gain function (for an input halogen lamp). The observation of star Alpha Lyr (Vega) is used for evaluate the curve.
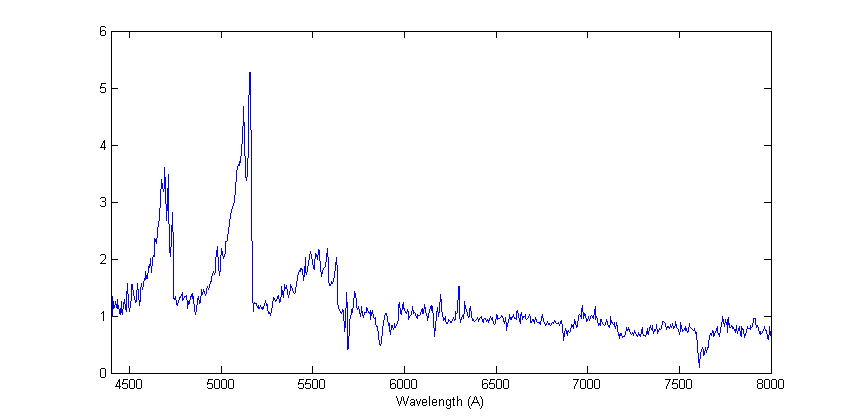
Spectral profile of coma after division by the calibration gain function response.
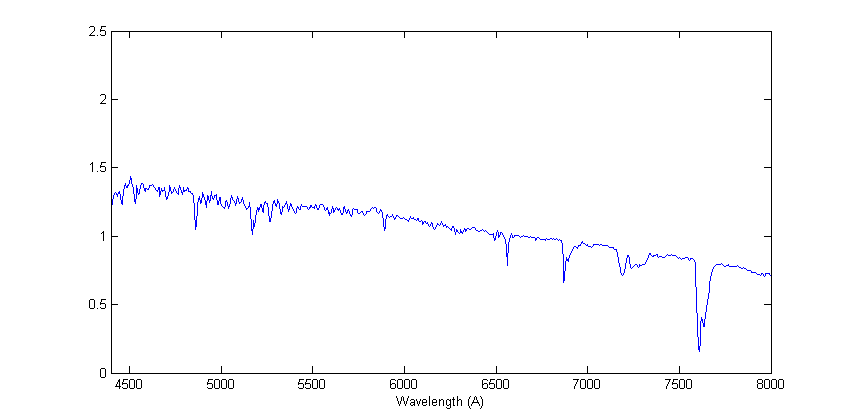
Spectrum of star HD126054 (solar type) used for remove Sun spectral signature.
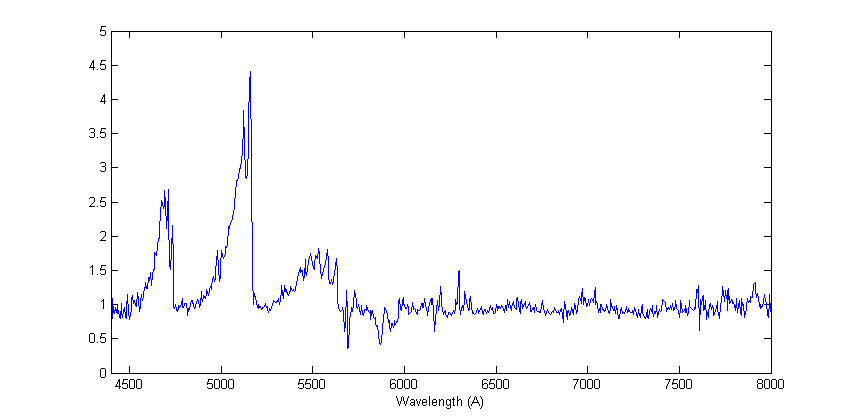
The division by the solar type star give the final coma spectrum of Lulin 2007. Note: the 7600 A O2 telluric band is now removed.
Result for the February 22.0, 2009 (exposure 9 x 15 min.)
(the nucleus and coma spectra are now separated)
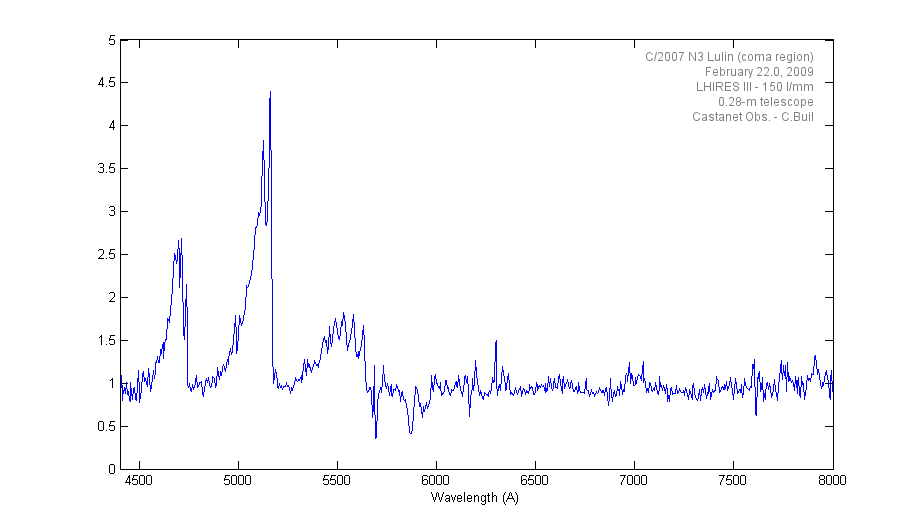
Spectrum of coma.
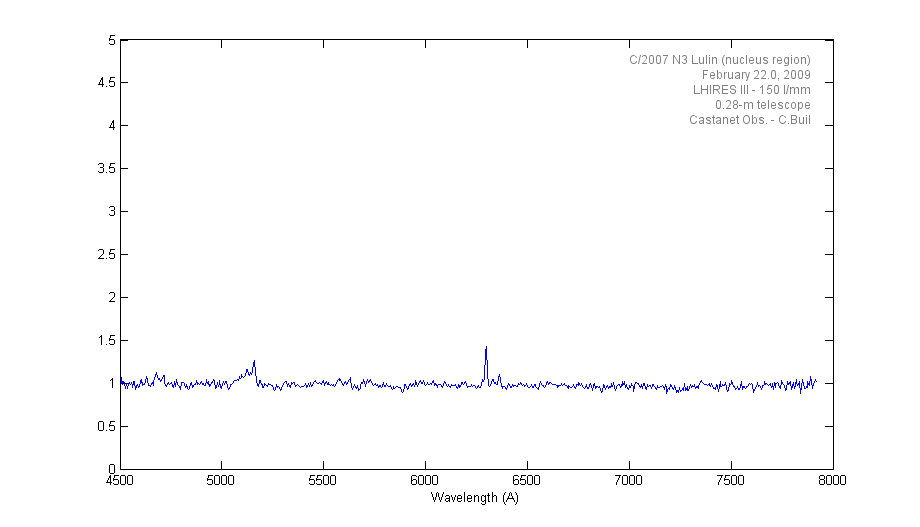
Spectrum of nucleus (note the auroral lines [OI] near 6300 A).