Other techniques for display an image
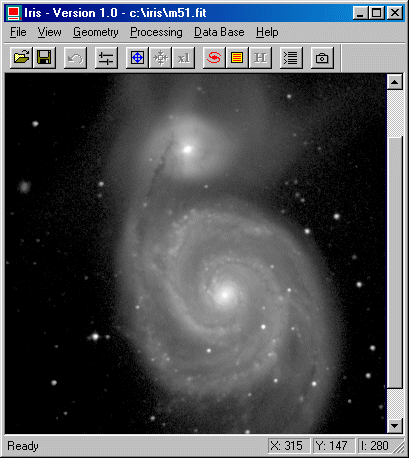
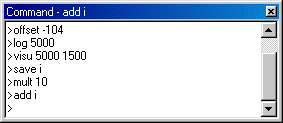
With very simple image processing, however, it is possible to get an overall idea of the distribution in one visualization. To do this, we will calculate the logarithm of the image. The level of the sky background should be between levels 20 and 50 for optimum efficiency. The BG command tells us that the sky background is around 134 for the Messier 51 image. We will offset the image by 104, (134-104=30), which brings the level down enough.
Warning: Since you cannot compute the logarithm of negative numbers, the background sky pixels should not have a negative value after applying the offset. Otherwise, they cannot be displayed.
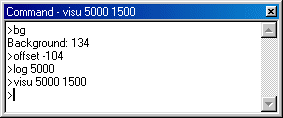
Type:
OFFSET -104
LOG 5000
VISU 5000 1500
The above thresholds are characteristic of a logarithmic display.


Save the result (SAVE command):
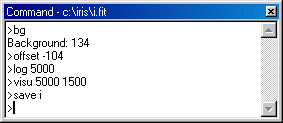
This command produce the image file I.FIT. Now, note the image dimensions from the Info... command (File menu):
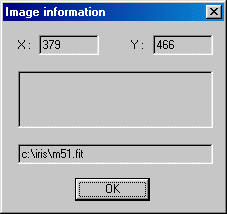
The image M51.FIT size (or I.FIT size !) is 379 by 466 pixels.
Instead of simply displaying shades of gray, a more quantitative analysis of the information in the image can be obtained with isophote curves. Try the Isophotes... command from the View menu:
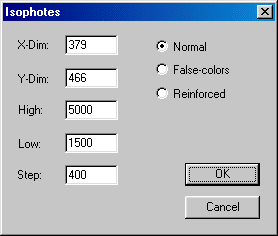
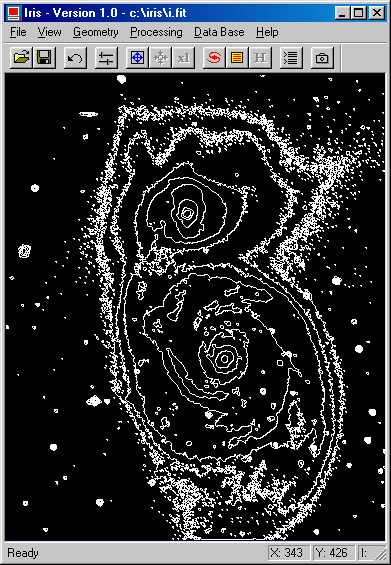
Finaly multiplicate the isophotes curves image by 10 and add the isophotes image and the logarithm image of Messier 51:
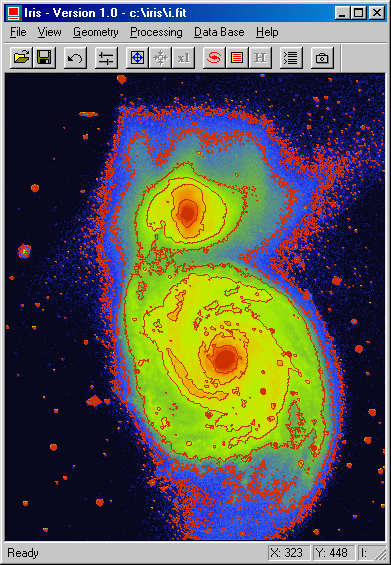
Try another thing. Reload the M51 image, then execute the Modified Equalization from the View menu. All the parts of the galaxy are now clearly visible.
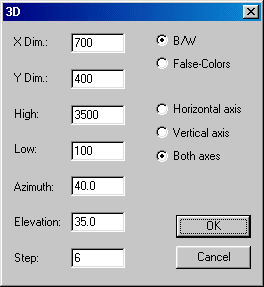
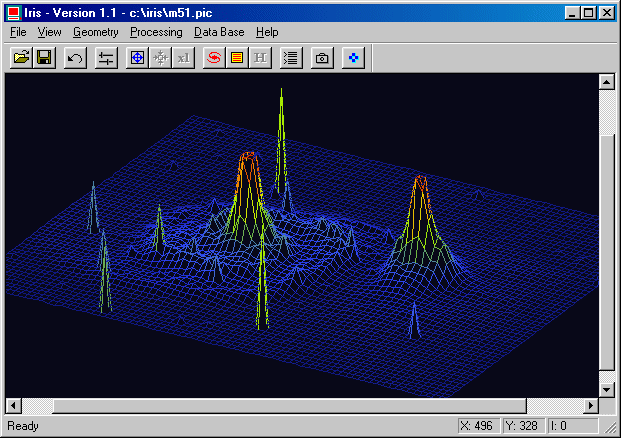
Iris has a complete 3D visualization possibility. Try for example:
Other aspects of the Iris interface:
