T60 MISSION
Pic
du Midi Observatory
28 August to 2 September 2002
André Rondi - Thierry Maciaszek - Christian Buil
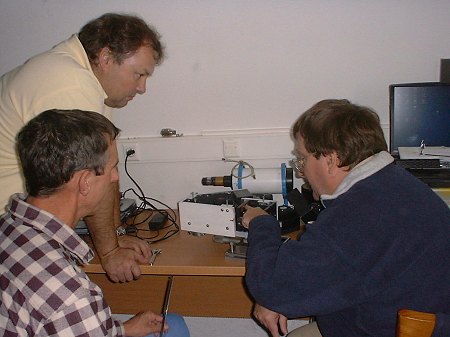
The final setup of the spectrograph at Pic du Midi by the team member's: Thierry Maciaszek, André Rondi and Christian Buil.
For technical informations about the spectrograph used click here. The only differences for this run at Pic du Midi Observatory : the collimator objective is a f2.8 Leitz photographic lens of 80 mm focal length and the camera objective is a 50 mm focal length f/1.4 Nikon lens. The dispersive element is an Edmund 600 grooves/mm grating blazed to 5000 angstroms (mean dispersion of 2.87 A/pixel for the visible part of the spectrum, R=1000 @ 6563 A). The camera is an Audine KAF-0401E (768x512 pixels of 9 microns size). The data are processed with Iris and VisualSpec softwares. Many thanks to Philippe Dupouy for the determinant technical support at Pic du Midi Observatory.
Look also the report of your first "spectro" mission at the 24-inch (July 2002).
and... visit the Association T60 site: http://www.astrosurf.com/t60
Spectral samples
SPECTRUM OF MESSIER 1
SPECTRUM
OF MESSIER 27
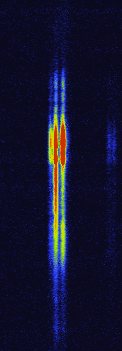
SPECTRUM OF MESSIER 76
SPECTRUM
OF NGC7662
SPECTRUM OF MESSIER 8
SPECTRUM
OF NGC1499
SPECTRUM OF PLANET SATURN
SPECTRUM OF MESSIER 1 - THE CRAB NEBULA
The image below shows the 2-D spectrum of Crab Nebula. It was constructed from 8 x 3 minutes CCD exposures obtained on 2002 September 2. The slit of spectrograph is positioned nearly at the center of M1. The airglow atmospheric lines are removed (use of the information apart the nebula spectrum). The colors of the image are artificial of course but are representative of the covered spectral domain (RAINBOW command of Iris software).

Because the relative motion of the gaz towards and away from the observer, the emission lines of the nebula appear very distorted. The double peaked structure of the emissions features is characteristics of the rapid expanding shell of gaz. We measure the maximum shift between the redshifted and blueshifted region of the lines. The result for the filament image at the oxygen green line level is 14 A. By dividing this by the wavelength of the line (5007 A), then multiplying this result by the speed of light (300 000 km/s), we obtain the relative velocity between the knots, here 2400 km per second. So, the radial velocity of the knots approaching (or receding) the observer is of 2400/2=1200 km per second. The estimated error is of ±180 km/s. The synchroton continuum emission of the Crab Nebula is faintly but clearly visible.
SPECTRUM OF MESSIER 27 - THE DUMBELL NEBULA
2-D spectrum of Dumbell Nebula (M27). Stack of 15 x 2 minutes exposures. The slit was positioned to include a bright knot. The location of the slit is show in the standard image of the nebula (extracted from the BT-Atlas)
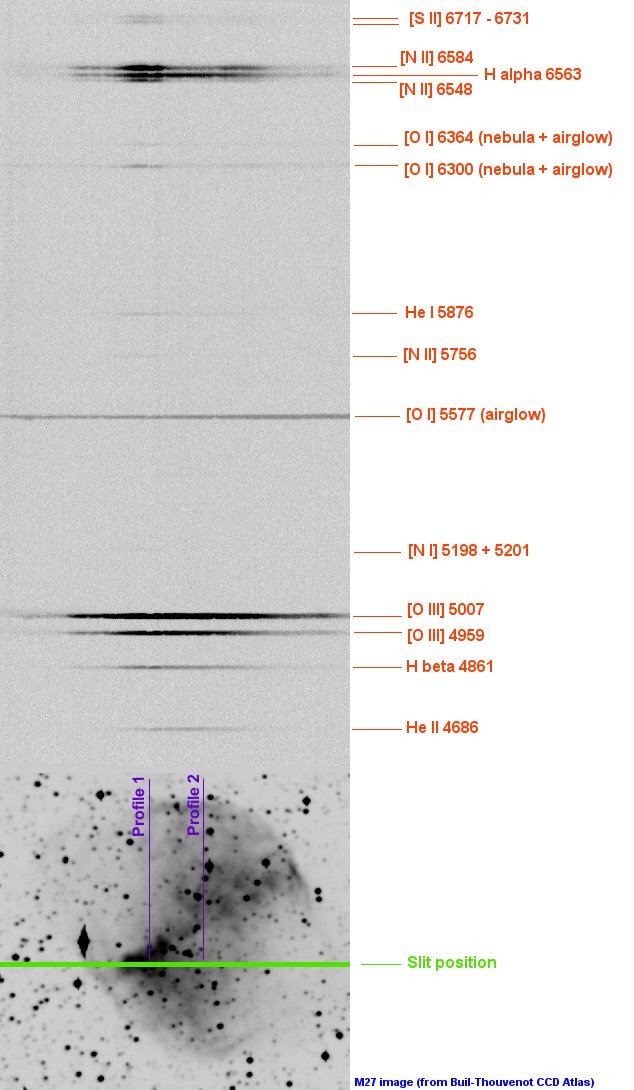
The spectrum is notably different along the nebula surface (compare slit intensity of hydrogen H-alpha and adjacent nitrogen [N II] lines for example). This traduces changes in chemical composition and ionization in the nebula, and explain the spectacular colors of planetary nebulae. The two graph below shows the spectral profile along the Profile 1 and 2 identified into the standard image of M27 (the instrumental response is removed).
For tricolor imagery, the separation of H-alpha and ionized nitrogen informations is a real problem because the separation of the lines is only 20 angstroms. So the R band of a RGB tricolor is a merge of two distincts physical important lines. We propose the following observational strategy for separate hydrogen and nitrogen images:
(1) take a H-beta image through a moderate
wide interference filter (10 nm bandpass)
(2) multiply intensity of this
image by 2.9 i.e. the theoretical intensity ratio between H-alpha and H-beta lines
(in absence of reddening).
(3) your hypothesis : the H-alpha 2-D image duplicate
H-beta 2-D image, so subtract the later to an R wide band image. This
give the [N II] image of the nebula

Left,
the nearly blended H-alpha and [N II] pair. Right, the [N II] lines after subtraction
of a scaled H-beta (2.9x) to the H-alpha line.
(4) compose the tricolor with :R = 2.9 x H-beta, i.e. similar to a H-alpha image, G = [N II] image, B = a wide band image centered near 5000 A, i. e. including [0 III] image. Because the scaling factor of the H-beta frame, it is recommended to acquire a high signal to noise ratio image for this band.
Useful theoretical intensity ratio of Balmer lines:
I(Ha)
/ I(Hb) / I(Hg)
/ I(Hd) = 2.86 / 1.00 /
0.47 / 0.26
A value I(Ha)
/ I(Hb) > 2.86 is informative
of the reddening of the studied object.
For He I lines we have:
I(3889)
/ I(4471) / I(5876) = 2.7 / 1.0 / 2.5
For the ion [O III] the typical ratio
I(4959) / I(5007) should be 0.34.
The Messier 76 spectrum is the result of 6 x 120 seconds exposure the 2002 September 2.
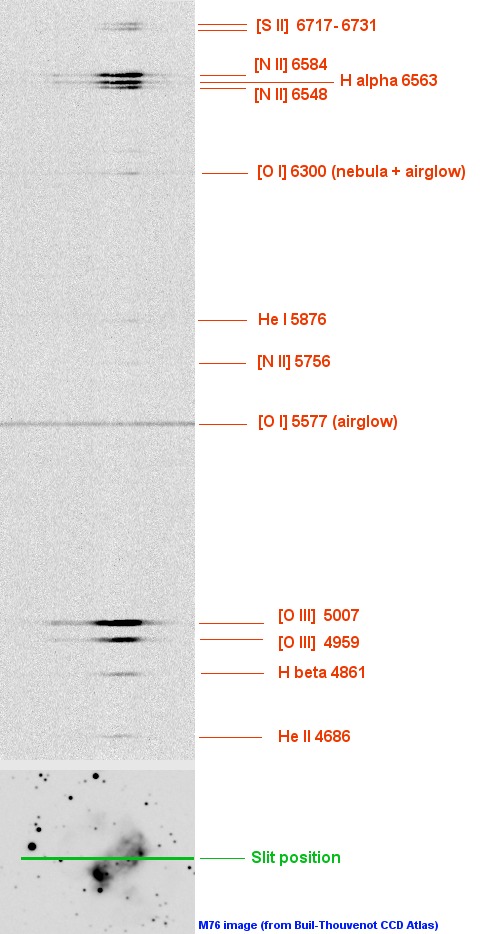
The mean spectral profile of M76 nebula:
The spectrum of the planetary nebula NGC 7662 is the result of addition of 15 x 2 minutes elementary images.

Below, detail of the NGC 7662 spectrum. The [O III] 5007 line is normalized to 1.00. The spectral response of the instrument is corrected.
The Ha/Hb ratio found is of 2.90 for this spectrum (the relative line intensities of emission lines were measured by integrating the flux under the lines). The measured [O III] ratio I(4959) / I(5007) is 0.33, a result very near to the theoretical value.
SPECTRUM OF MESSIER 8 - THE LAGOON NEBULA
Narrow slit spectrum of Messier 8 nebula. Exposure: 10 x 60 seconds. Spectral sampling of 2.87 A/pixel.
Details of the red part of the spectrum and lines identification:
SPECTRUM OF NGC 1499 - THE CALIFORNIA NEBULA
NGC 1499 is a very large nebula and its spectrum is very faint (the nebula is not visible through the slit bu using the zero order direct image mode of the spectrograph). The spectrum is the sum of 4 x 300 seconds frame near the middle of the nebula. You can note the quasi absence of the bleue-green [O III] lines. The atmospheric airglow lines at 5577, 6300, 6364 A are not removed from the data. For a H-alpha image of the nebula click here.
Methane (CH4) is an important constituent of the atmosphere of Saturn (and also Jupiter), so this gaz exhibit strong absorption bands, notably in the red part of the spectra.
The 24-inch telescope is used at the primary newtonian focus (f=2.1 m). The next image show the slit position relative to the Saturn system:

The following images shows the simultaneous spectra of Saturn disk and rings between 4900 A and 8100 A. This later is supposed a solar reflected spectrum (i.e. rings are spectral neutral reflector). In the red and infrared part the image exhibit the classical rotational-vibrational spectrum of oxygen and water in the terrestrial atmosphere, but the Saturn disk shows additional absorptions due to the methane (and some other molecules).

Saturn
spectrum - colored version

Saturn
spectrum - black & white version
The spectra is a composit of 9 x 3 seconds exposures. Two sequences of acquisition are merged for cover the spectral domain.
The graph below permit to compare disk and rings spectra. The spectra are corrected for the instrumental responsivity, so the rings spectral distribution is characteristics of a G2V stars, i.e. the Sun:
The ratio of the disk and the rings spectra is the true spectral reflectance of Saturn:
Note the increase of the reflectance from bleue to red. The methane bands in the covered spectral domain are identified. A very strong absorption centered at 8931 angstroms is not visible here (limits of this band are 8480-9350 angstroms). The ammonia bands (NH3) are not clearly visibles in the Saturn spectrum, but can be faintly detected from the Jupiter spectrum at 5520 angstroms and 6475 angstroms.
Web page of André Rondi : http://astrosurf.com/rondi/
Web page of Thierry Maciaszek : http://perso.wanadoo.fr/thierry.maciaszek/Index.htm