NOVA
CYGNI 2001 (V2274 CYGNI) SPECTRA
The nova Cygni 2001 was discovered
by Yuji Nakamura (Mie, Japan) on July 13.651 UT at V=11.9. Position:
R.A.= 20h07m17s.94, Decl. = +36°04'37".2 (equinox
2000.0). IAU circular 7666.
This page show optical spectra taken at Pic du Midi Observatory (France) using a spectr'aude spectrograph mounted on two instruments:
- The 21.01 July UT and 23.03 July UT, a Takahashi refractor FSQ-106 (D=106 mm, F=530 mm) and a GP-DX mount, operated by Christian Buil. Sampling of the spectra of 4 A/pixel.
- The 21.97 July UT, the one-meters
telescope of Pic du Midi Observatory, operated by Francois Colas
and Christian Buil. Sampling of the spectra of 4 A/pixel.
At the date of observations the V
magnitude of the nova is around 12.8.
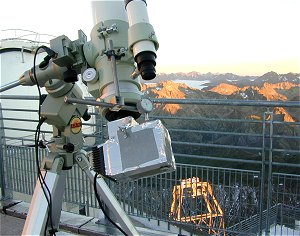
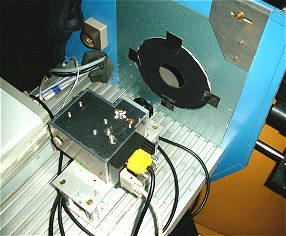
Left, the spectr'aude spectrograph
at the focus of the FSQ-106 refractor, right, at the Nasmith focus
of the 1.06 meter telescope of Pic du Midi Observatory.
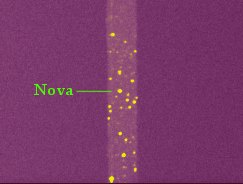
Aspect of the nova Cygni through
the slit of the spectr'aude (large-slit mode) and the FSQ-106 refractor,
the 21.01 July 2001.

The 4 Angstroms per pixel spectrum acquired with the FSQ-106 refractor (CCD Kodak KAF-0401E) on July 21.01 UT. Composite of 39 individual spectra exposed each 120 seconds. Note the intense H-alpha emission at right.
Comparison of the three spectral profile acquired. The integration time for the 21.01 July spectrum is of 78 minutes (composite of 39 two-minutes individual images - slitless mode). The integration time for the 21.97 July spectrum is of 14 minutes (composite of 7 two-minutes individual images - narrow slit mode). The integration time for the 23.03 July spectrum is of 90 minutes (composite of 45 two-minutes individual images - slitless mode). The spectra images where processed to remove bias and dark current, corrected for a flat-field, and calibrated against a standard flux for Vega. Then, the spectra are normalized for the wavelength of 6000 angstroms. The correlation between this spectra in the continuum is very good (the details are significants).
Detail of the H-alpha spectral region. The increase of the H-alpha emission relativement to the continuum is very significant and fast during the observation period (a factor two in only two days).
Enlargement of the background level.
First, numerous broad P-Cyg emission lines are visibles. Second,
the H-beta intensity (at 4862 A) as an evolution similar to the
H-alpha line. Third, note the regular slant of the continuum (the
level increase toward the red).
