For an instant start-up in CCD spectrography, you will need an irisation filter for special photographic effects such as Cokin's #40 filter. Its cost of 300 F (50$) is the only one to incur in order to obtain the first spectrum using your CCD camera.

Cokin's
#40 filter, slightly modified with a pair of scissors so it fits
the Aude Association's filter holder. It has 240 grooves/millimeter.
You will have to install the filter 2 or 3 centimeters in front of the CCD's surface. The filter holder's drawer will probably make this easy. If needed, the Cokin filter holder can easily be modified, since it is made of plastic.
Aim at a star field, use an exposure time of a few seconds, and you will obtain an image such as the one in figure 16.
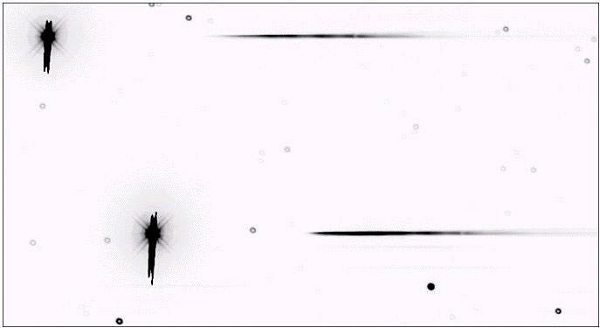
Negative
image of a star field observed through a transmission grating. Captured
with a Cokin #40 filter and the 190 mm flat-field telescope @ F/D=4.
A neat trick: with a slitless spectrograph, one should manage so
that the spectrum is oriented according to the north-south direction.
In this manner, any periodic tracking error will have few consequences
on the spectral resolution (the spectrum widening in the direction
of the spectral lines will be compensated by the binning operation,
as will be seen further on). Note the defocus at the zero order
(you can see the central obstruction of the telescope).
All stars in the field will contribute a spectrum, sometimes too weak to be visible in this reproduction. Note the spectra are somewhat narrow, a sure sign that they are properly focused, but at the same time star images at order 0 are strongly out of focus, which betrays field curvature implied by this type of construction. Looking carefully at the spectra you will see a few spectral lines, and in particular a "red" line at 7609A from oxygen in the atmosphere.
The following figure shows how to extract a field star's spectral profile.

Figure 17. Extraction technique for the spectal
profile.
An important step in spectral lines processing involves computing the plate ratio P and creating a graduation along the horizontal axis. To this end one uses some easily identified spectral lines such as atmospheric O2 at 7609A (in fact more than one line, but close enough to be seen as a single line within the spectrograph's resolution). On the spectral profile, the distance between this line and the order 0 image is measured. Let us assume the value is 178 pixels. Since the pixel size is 9 microns, the distance e in millimeters between the line and order 0 is : 178 x 9.10 –3 = 1,602 mm. Since the grating has 100 grooves/mm one then computes the diffraction angle b for 7609 A, and finds b=4,364°. Then d, distance between the CCD and the grating, is expresssed as

The plate factor is then computed : P = 4759 A/mm. This is an instrument's constant parameter that must be determined only once if the system is not modified.
Now on, in order to estimate wavelength l for a spectral line whose position in pixels x is know, the following formula should be applied (dispersion is supposed to be linear here)

where l0 and x0 are respectively the wavelength in Angstrom and the position in pixels of the reference line, P the plate factor in A/mm and e the pixel size in mm.
The next example show the spectral profile of Vega obtained with a simple Cokin #40 filter.

Vega's spectral
profile. The blue part of the spectrum is on the left, the red part
being on the right. The main lines have been shown. One notices
the hydrogen series obvious in type A0 stars. The infrared part
readily shows molecular bands of gaseous components in the Earth's
atmosphere: the O2 B band between 6850 and 7020 A, the H2O band between 7000 and 7400 A the O2 A band
between 7580 and 7750 A.
This spectrum is spectrally limited by the CCD's responsivity. On the left the spectrum starts in the blue from about 3900 A. On the right, it disappears in the infrared at a wavelength of about 1 micron (in the figure the spectrum was voluntarily interrupted at about 8000 A as a consequence of orders superpositions). Between those limits, the quantum efficiency has a complicated evolution and numerous intensity variations in the spectrum take origin in the CCD detector itself. An important part of spectrum processing consists in suppressing this detector contribution and also that of the grating's efficiency which itself depends on the wavelength. This is the radiometric calibration procedure.

High
quality diffraction gratings are available with Jeulin (a firm distributing scientific equipment for
the french Education Nationale). They are presented in slide holders
with a glass window. A fundamental property of those gratings is
that they concentrate an important part of the optical flux in one
single order (they are blazed). As a consequence, the spectrograph's
efficiency is enhanced. the holders fit Aude's filter holder.
Here one can see one of the last prototypes for the Audine camera (the case has not been anodized
yet). We used the grating model with 100 lines/mm that perfectly
fits our application (Catalog reference : 212 022 01 – Price : 123
F TTC, ie $25). Click here for reading performances of this device.
Goto index page Previous page Next page