SUPERNOVA
SN1999ac
This page expose my first success in the observation field of supernova spectra. The target is supernova 1999ac, discovered on February, 26 1999 (KAIT TEAM) in galaxy NGC 6063 (AD=16h07m15.0s, Dec=+07°58' 20.4") at magnitude 15,2. A spectrum taken on February 28 (Las Campanas Observatory) show that SN1999ac is a particular type Ia supernova (see IAUC 7122).
To acquire the spectrum I use a 190-mm telescope (F/D=4) and a dispersive grating placed directly in the converging beam of the telescope, just front to the CCD detector.
The grating is an Edmund Scientific model - 70 lines/mm. The grooves are engraved directly on a gass piece 25x25x3 mm.
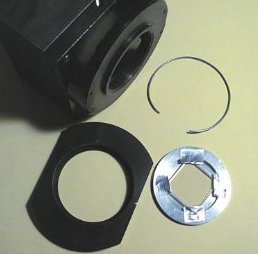
Figure 1. The transmission Edmund Scientific grating (the grating is maintained with ribbon adhesive on an aluminium plate...) fitted into the filter holder of an Audine camera.
The Audine camera was equipped with a CCD Kodak KAF-0401E. Advantages of this CCD in comparison of the traditional KAF-0400 are a sensitivity 1.6 times higher in the green part of the spectrum and a spectral sensitivity extended close to 3000 A (instead of 4000 A for the standard KAF-0400). Distance beetwen CCD and engraved surface of the grating is 19,86 mm. Inverse dispersion is 64,65 A/pixel.The observation was carried out in an urban environment (Ramonville-Saint-Agne, close to Toulouse).
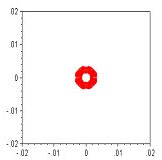
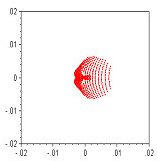
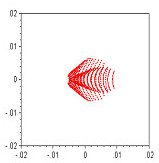
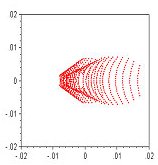
Figure 2. These spot-diagrams, obtained with a ray tracing program, shows the size of a point image on the CCD for the optical configuration used at the time of the observation of SN 1999ac. Units are in millimeters. On upper left, one finds the zero order image (direct image, not diffracted). It may be noticed that this image is slightly out-of-focus (the central obstruction is visible). Then, going from upper to down and left to right, one finds, for order #1, the spot images at wavelengths of 300 nm, 500 nm and 700 nm, respectively
.
The focal surface on which the spectrum is formed
has a curvature radius of about R = (grating-CCD distance)/3 = 20/3
= 6,7 millimeters. The distance along CCD surface between order
#0 and order #1 at 750 nm is approximately H=1 mm. So, the defocus
X between order 0 and order 1 at 750 nm is given by the formula:
One finds X = 80 microns, which is relatively small. Obviously, the quality of the spectrum can be improved by defocusing slightly the zero order image.
You can note on figure 2 that in all cases (except perhaps for the infra-red) the theoretical spot images have a size equivalent to the pixel size (9 microns). In the present case, this is the seeing that limits the spectral resolution. The FWHM being about 1.9 pixel, and the spectral resolution is of 125 Angstroms (i.e. 12.5 nm).
The image below shows the result of the sum of 43 images posed 2 minutes each (1h26mn total exposure) taken on 1999 March 20 between 0h53 and 3h10 UT.
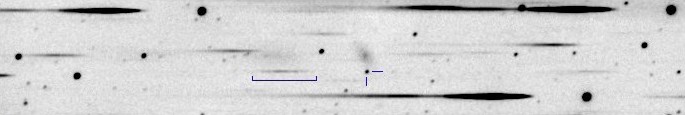
Figure 3. The field of galaxy NGC 6063. The position of the surpernova is indicated by a cross.Notice that the spectrum of the galaxy is slightly visible.
The great bleue sensitivity of CCD KAF-0401E is the order alias. In fact, near 7000 A approximately, the first order spectrum is polluted by the beginning of the order #2 spectrum (the bleue part of it spectrum, towards 3500 A). Normally IR first order observation require to interpose in the optical beam a high-pass filter, i.e. a filter which transmits the high wavelengths and stops bleue. In practical, the order #2 spectrum remains relatively faint for wavelengths lower than 4000 A, so that we may assume that order #1 spectrum is usable up to 8000 A.
The image at order #0 of the supernova is perfectly usable to make white light photometry. A measure on this image gives a magnitude of 14.78 by using the GSC stars reference catalogue.
The next figure shows, in superposition, the spectrum of SN1999ac (in red) and the spectrum of the star SAO83560 (in blue) of spectral type A0V, observed the same night and with the same resolution for photometric calibration use.
Figure 4. Red curve, the spectrum of the supernova 1999ac. In bleue, the spectrum of SAO83560 (type A0V). Notice that the vertical scale is relative and the photometric calibration was not made. Only a spectral calibration was carried out. Consequently, the spectral response of the CCD (and the spectrograph) modulates the profile considerably.
The comparison of these two spectra shows clearly that absorption towards 5000 A is not related to spectral response of the CCD. This is the same for absorption towards 4300 A and 6200 A, that seems quite real. Unfortunately, it does not seem to exist in so far published spectra of this supernova. The only information on the spectrum of SN1999ac had comes from the circular UAI 7122 where it is announced that the lines Fe III to 4300 and 5000 A are well marked as well as the lines H and K of Calcium towards 3800 A. The absorption line of Si II is announced towards 6350 A. The spectrum beyond 7000 A is not described. Our spectrum of SN1999ac is relatively comparable to this description and with that of SN1999aa according to circular UAI 7122.
Note that typical SNe Ia spectra around maximum light show absorption features near (rest wavelength, no spectral shift taken into account) 6150 A due to SiII and near 3750 A from CaII (H & K lines). Near maximum other absorption appear near 4000 A (SiII, CaII), 4900 A (SiII, SII), 5300 and 5500 A (SII), 5700 (SiII), 7500 A (OI, MgII) and at 8250 A (CaII). Some week after maximum the 6150 A SiII and 3750, 8250 A CaII absorption are srong. Other absorption near 4100, 4400, 4850, 5050, 5400 A are due mainly to FeII.
Radiometric calibration is a major operation
for a good astrophysical interpretation of a spectrum. It eliminates
the instrumental response from the raw spectrum and reveals
the true flux distribution. Figures 5 to 9 show the procedure to
calibrate (for a complete description of typical spectra reduction
click
here).
Figure 5. Photometricaly uncalibrated spectrum of SN1999ac.
Figure 6. The synthetic reference spectrum of a A0V star which will be used to deduce the spectral response from the instrument (Pickles, PASP, 110:863-878, July 1998). Its spectrum, with steps of 5 A, was smoothed in order to degrade the spectral resolution so that it is equivalent to that of our spectrograph (curve in blue).
Figure 7. The raw spectrum of star SAO83560 (in red) and the synthetic spectrum of reference A0V star smoothed to the same resolution (in blue). Some spectral lines are identified.
Figure 8. The division of the spectrum of star SAO83560 by the spectrum of reference gives the response of the instrument, which is essentially the CCD spectral response (here in relative intensity). To simplify the processing, the atmospheric transmission was not taken into account. It is legitimate because the supernova was observed with a zenithal distance near to the one of star SAO83560.
Figure 9. The raw supernova spectrum (figure 7) was divided by the instrumental response (figure 8). The result is the spectrum photometrically calibrated (in relative intensity) of the supernova 1999ac.
Some lines are identified in figure 9. They are characteristic of a type-Ia supernova spectrum close to maximum brightness. The relative low depth of the SiII at 635 nm seems in agreement with the indications of UAI 7122 circular.
From this result, we can affirm that the observation
of the spectrum of supernovae by the amateurs is possible. Indeed,
it is necessary to point out here the modest diameter of the telescope
used: 190 mm (in fact, nearer to 180 mm if one considers the strong
central obstruction). Moreover, the site of observation is
extraordinarily unfavorable for this type of observation for reason
of very high level of luminous pollution (naked eye limit magnitude
of 2.5). A fine analysis of sky surface brightness was carried out
the same night as observation of SN1999ac. One finds 18.5 by arcsec2 in B, 16.9
by arcsec2
in V, 16.6 by arcsec2 in R and 16.9 by arcsec2 in I. As a comparison, in a normal good site for
amateur, we have 20.0 in V. The following table provides the sky
brightness in mag/arcsec2 in the best sites of the planet associated
to the days from full Moon.
Day from new moon |
U |
B |
V |
R |
I |
Z |
0 |
22.0 |
22.7 |
21.8 |
20.9 |
19.9 |
18.8 |
3 |
21.5 |
22.4 |
21.7 |
20.8 |
19.9 |
18.8 |
7 |
19.9 |
21.6 |
21.4 |
20.6 |
19.7 |
18.6 |
10 |
18.5 |
20.7 |
20.7 |
20.3 |
19.5 |
18.3 |
14 |
17.0 |
19.5 |
20.0 |
19.9 |
19.2 |
18.1 |
In other words, the sky background
in Ramonville-Saint-Agne is 15 times more luminous than a
good sky in countryside. In spite of that, the spectrum of
SN1999ac is perceptible on a raw image exposed 2 minutes. It appears
that an observer exploiting a telescope of 300 mm in a very good site
could follow the spectrum of a supernovae down to magnitude 17
approximately.
