The steps for tricolor processing are the following: 1. Acquisition of the three fundamental components
of the RGB image, Some time you may have an image in only two colors (R&G or R&B, etc). The following strategy should be used: 1. Calculate the spectral ratio of the two
images (one is divided by the other). The result is the image
H, The result is an image whose level represents the albedo of the object, and whose color represents the spectral signature (here a spectral ratio). |
|
|
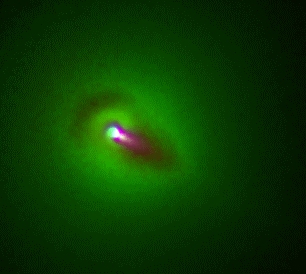
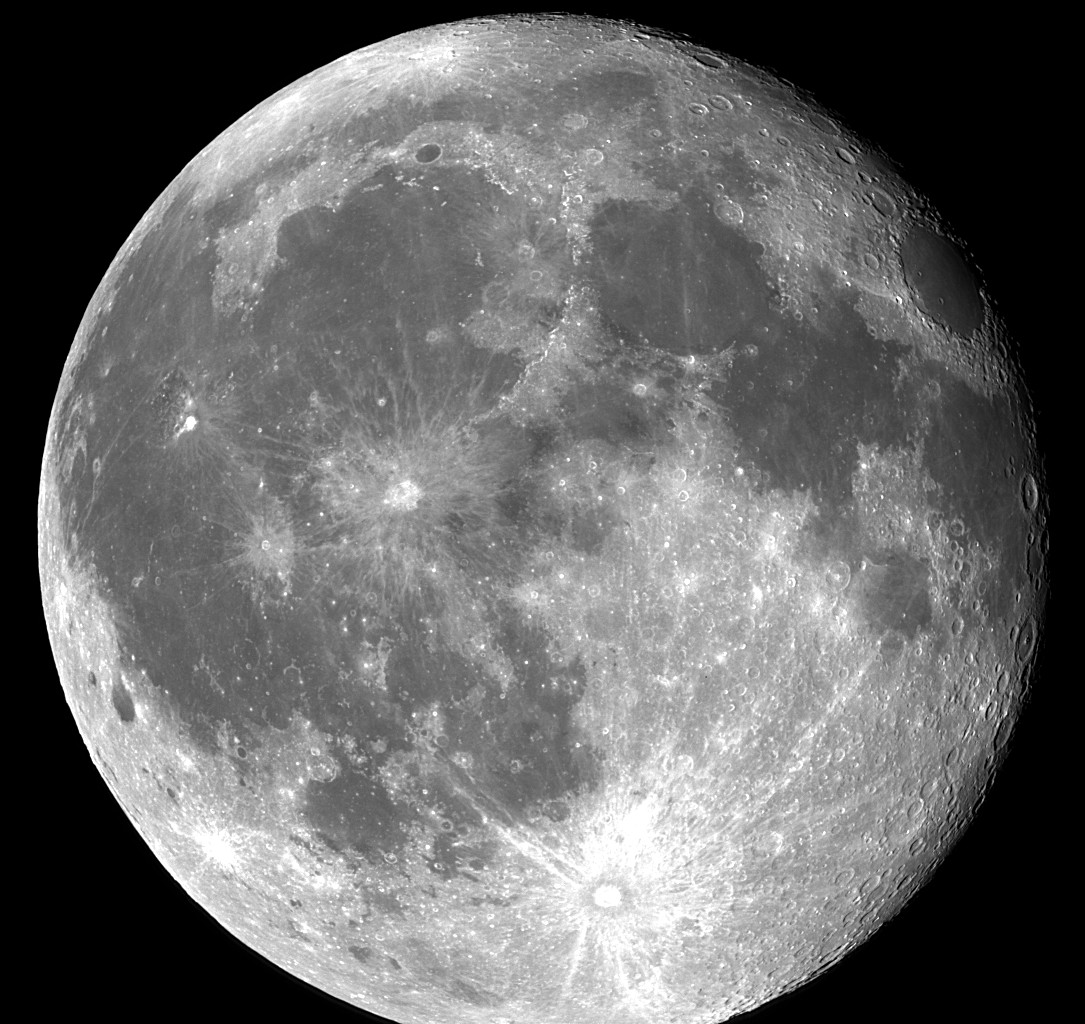
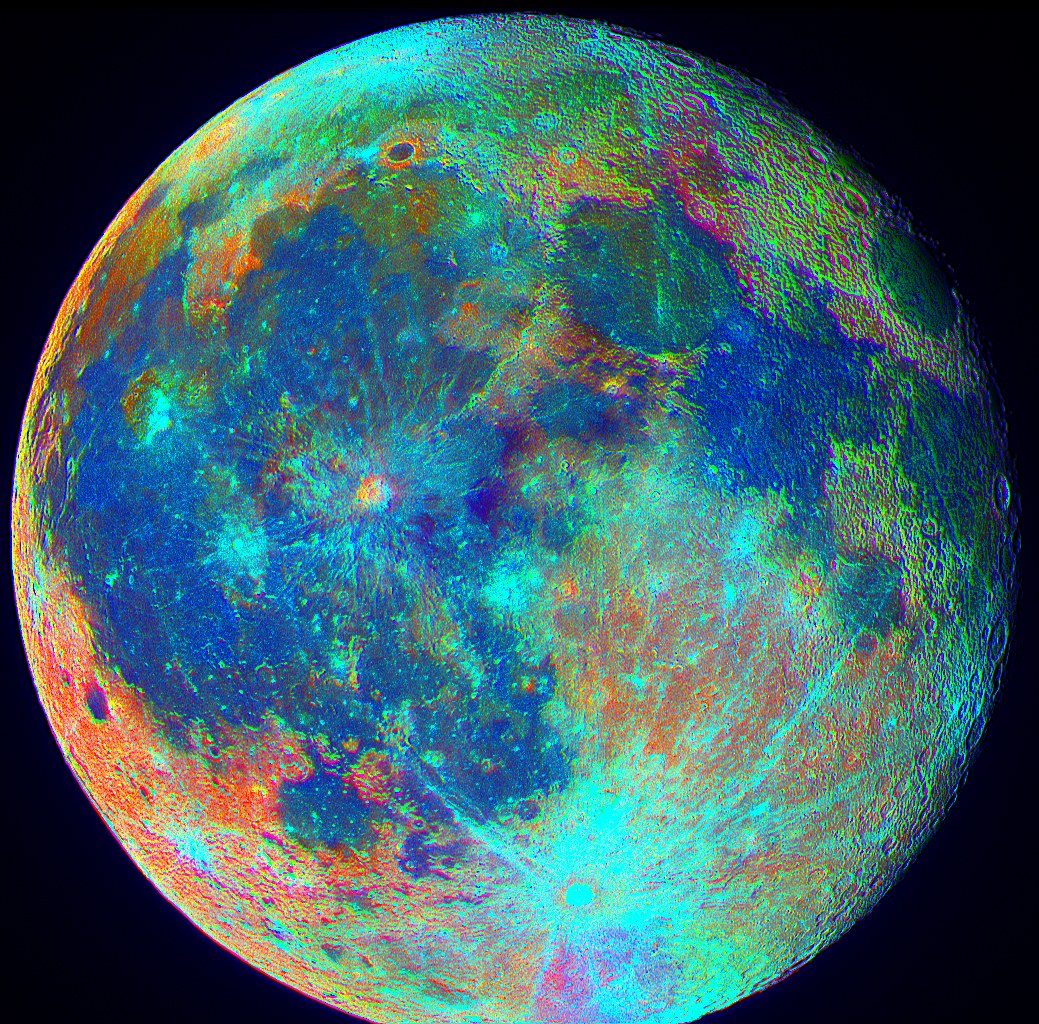
Figure 5. Left, a monochromatic Moon image carried out with 400 nm interferential filter (blue spectral band). Instrumentation: Takahashi 5-inch refractor at f/10 + KAF-1600 directly at the focus. Right, true colors image taken with 400, 560 and 910 nm interference filters. Contrast and hue are accentuated considerably by using the mathematical property of the HSI space. Yes, the Moon is a colored object ! That gives an unique very useful frame to study the Moon geology. Click on the images to see a larger version! |
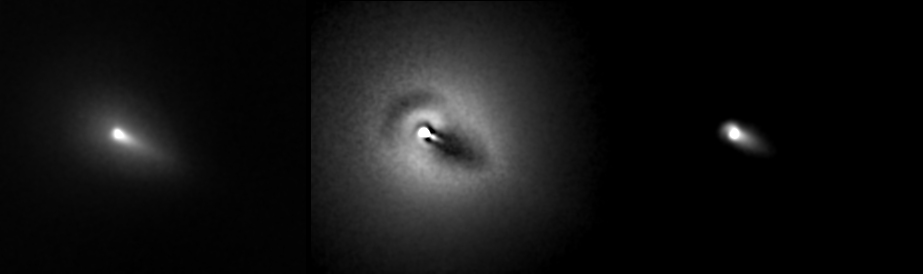
Figure 6. IGB (Infrared, Green, Blue) images from the center of Hyakutake comet. The figure show the frames B, G and I spectral bands respectively that have been used to create the tricolor image of figure 7. These filters are not very adapted to comet observation (the V filter corresponds about to the C2 lines, the B filter to the plasma tail if any, and the I filter to the continuum). Note the structures in the G band produced by dust and gaz jets going from the rotating nucleus. A spiral structure very close to the nucleus is visible in G & B bands. Images captured with a 5 inch fluorine Takahashi refractor at f/5.9 and a KAF-1600 in binning 1x1 and windowing mode on 1996/03/22 around 23H52 UT. |
The hue and saturation components defines the chromaticity of a color. It is important to note that chromaticity and intensity of a color can be considered independently. The very interest of HSI space is that it decorelate color tone and hue from brightness. This is why we can replace in HSI space the I component computed by the algorithm of conversion RGB towards HSI by a new high quality I image. While returning then in the RGB domain, we preserve the original colors, but with a boost in the details, a much cleaner image and a much high SNR comparatively has the initial true colors image. For further information on LRGB technique visit the links: http://www.ghgcorp.com/akelly/ For other applications of the LRGB algorithm,
click here (Iris software tutorial). |