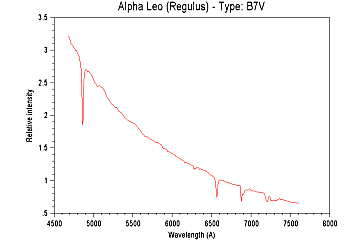
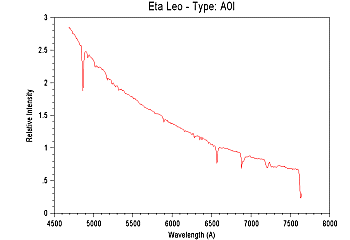
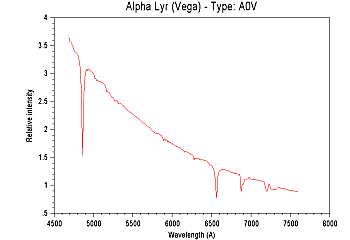
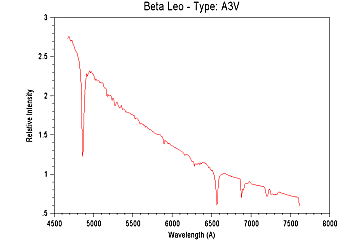
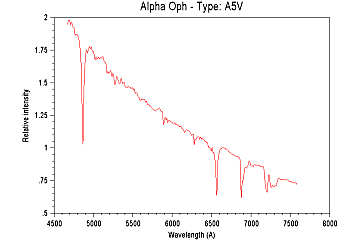
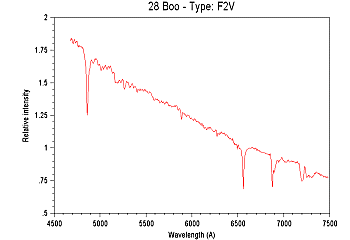
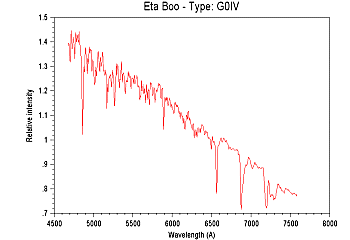
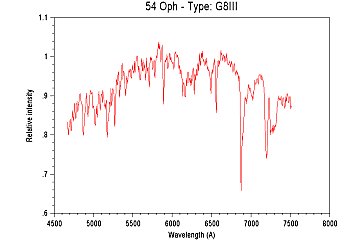
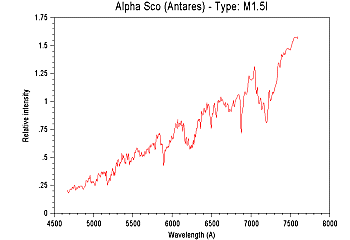
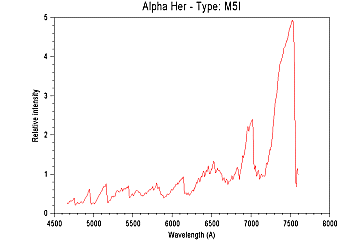
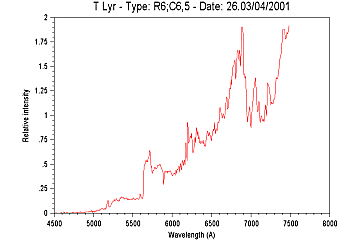
The following figures show some results characteristic of the low resolution spectrograph on a 106 millimeters refractor.

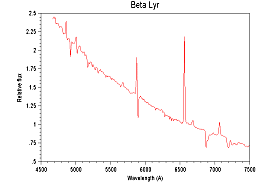

Radiometric processing steps of the spectrum of the Beta Lyrae star. In top on the left, spectral raw profile (this spectrum is modulated partly by the instrumental responsivity). In top on the right, the spectrum after division of the spectrum by the throughput. Continuum represent now a blackbody distribution. In bottom, the continuum was eliminated in order to facilitate the measurement of the intensity of the lines. The strong emission line is Ha. Some line present a P-Cygni profile (helium towards the left). See on chapter 4 the detailed sequence of processing of the spectra.
The sequence of spectra below was acquired on the night of 17 April 2001 and shows the evolution of the profile according to the spectral type.
Spectra of some stars while going from hottest to coldest. Note for example the subtle change between types A0V, A2V and A5V. the star 56 Oph is that which has the weakest bright of the series (exposure time cumulated of 10 minutes), which explains the relative low signal-to-noise ratio. The magnitude of this star is only 7.3, and yet the result obtained is very correct in spite of the instrument used (106 mm refractor). The Carbon-star T Lyrae does not produce practically any signal below the wavelength of 5000A, it is rather spectacular (the object is extremely red). Click on the graphs to obtain an enlarged view.
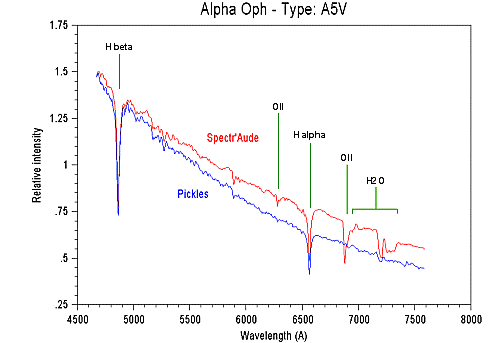
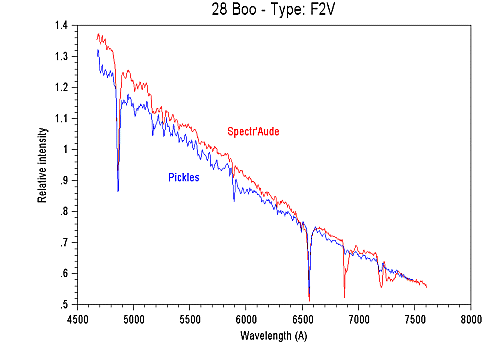
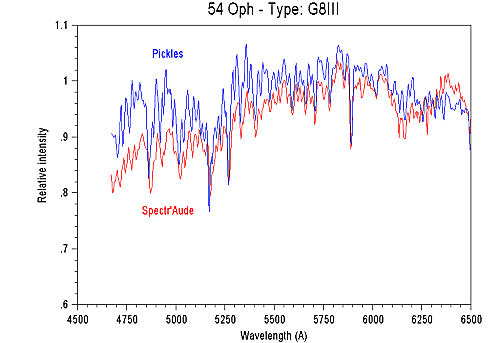
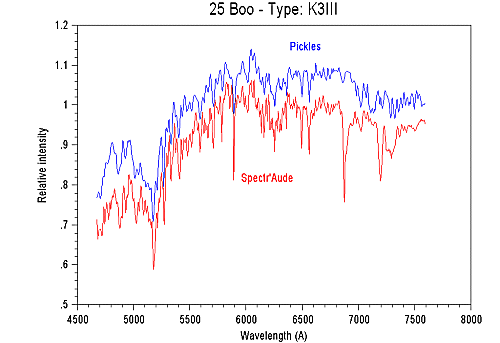
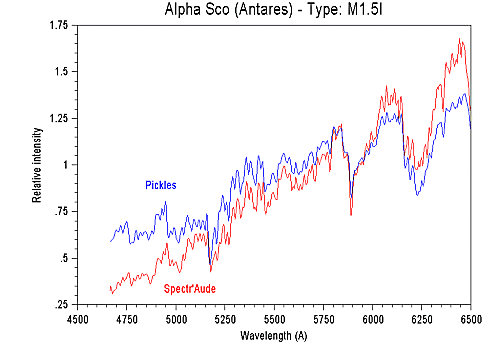
The sequence hereafter makes permit to compare the spectral profiles obtained with the spectrographe and with profiles extracted from the Pickles data base. The latter is a professional compilation of spectra for the majority of the stellar types with a sampling of 5 angströms (the sampling of the spectrographe is here of 4 angströms and the spectral resolution is very equivalent). It appears that the spectrograph generates spectra correlated very well with the Pickles base: the spectrograhe thus produces highly reliable data with a spectral resolution near of the hoped theoretical maximum (about FWHM=8 angströms, resolution power R=820 at 6563 angströms). The comparison of the spectral profiles is particularly spectacular on cold stars (K-type for example). One will note moreover than the radiometric calibration is relatively satisfactory and it is possible that noted variations are real.
Comparison between the actuale spectra (in red) and a professional data base (in blue). Click on the graphs to obtain an increased view.
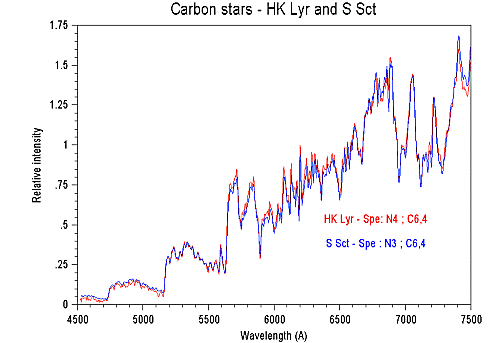
The graph which follows watch the strong degree of correlation between the spectrum of two carbon stars of similar spectral type. The stars in question emit most of flux in the infra-red. They are cold stars, but also of semi-irregular variable stars.
Superposition
of two carbon stars spectra.
Goto index page Previous page Next page
