|
|
| Sensitivity | Offset (ADU) | Read-out noise (ADU) |
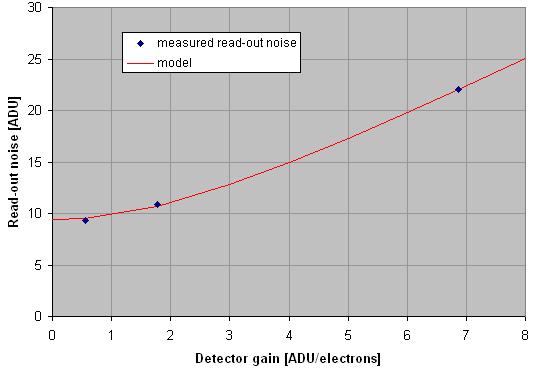
| 100 ISO | 1024 | 9.3 |
| 400 ISO | 1024 | 10.9 |
| 1600 ISO | 1024 | 22.0 |
| Signal S [ADU] | Total noise sTOT2 [ADU] | Gain g [ADU/electrons] | |
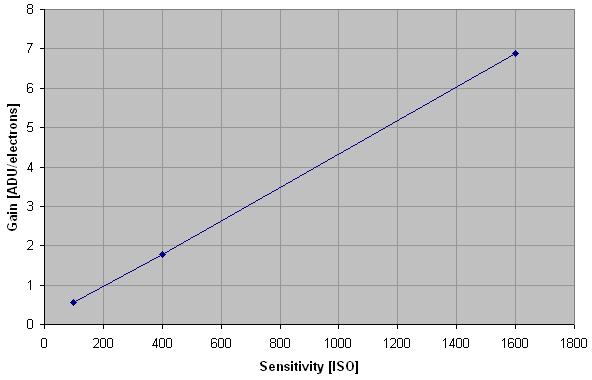
| 100 ISO - color plane 1 | 10987 | 75.5 | 0.55 |
| 100 ISO - color plane 2 | 6508 | 57 | 0.56 |
| 100 ISO - color plane 3 | 7780 | 61 | 0.52 |
| 100 ISO - color plane 4 | 10920 | 76 | 0.57 |
| 400 ISO - color plane 1 | 5268 | 91 | 1.90 |
| 400 ISO - color plane 2 | 2610 | 54 | 1.69 |
| 400 ISO - color plane 3 | 4594 | 80 | 1.73 |
| 400 ISO - color plane 4 | 5258 | 89 | 1.81 |
| 1600 ISO - color plane 1 | 10662 | 261 | 6.97 |
| 1600 ISO - color plane 2 | 4667 | 161 | 6.85 |
| 1600 ISO - color plane 3 | 9029 | 234 | 6.72 |
| 1600 ISO - color plane 4 | 10674 | 261 | 6.96 |
|
|
|
|
|