
Characterization and use of two Methane-Band (889nm) filters
António J. Cidadăo
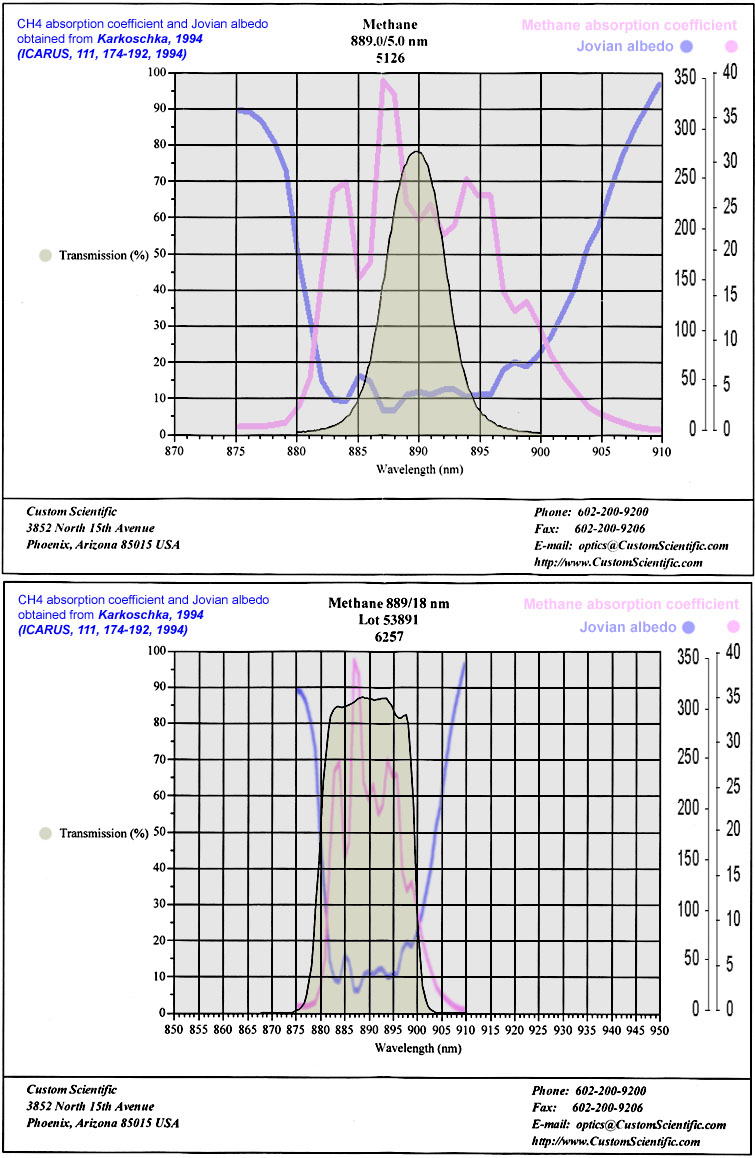
My methane-band imaging is based on two excellent narrowband interference filters (peak transmission at the same CW of 889nm) manufactured by Custom Scientific, both with high transmission (80-85%) but differing with respect to their FWHM (one is a custom-made 5nm-FWHM filter, and the other is the classical 18nm-FWHM filter offered by CS). The actual transmission scan of these two filters is shown below.
A correlation between the transmission profiles of these two methane-band filters with
published data (Karkoschka, ICARUS, 111, 174-192, 1994) regarding jovian albedo and
CH4-absorption coefficient around 889nm is shown below.
It is well depicted that the 889nm/5nm filter transmission curve fits very well within the maximum CH4-absorption coefficient, and sits at the middle of the jovian albedo minimum determined by CH4-absorption.
As a first glimpse, the same occurs with the broader 889nm/18nm filter, whose pass-band in practice spans the whole 889nm-centered CH4-absorption profile as well that of the jovian albedo minimum. However, at closer inspection, the left slope of the 889nm/18nm filter curve appears to be positioned (around 875-880nm) in a way that it would allow an effective transmission of certain wavelengths less prone to the desired methane-absorption effect.
A graph analysing this minor “off-band” positioning of the 889nm/19nm CH4-filter
(originated from the filter’s actual transmission scans and the inverse of the above
referenced Karkoschka’s methane-absorption coefficient) is shown below.
It is most obvious that within the pass-band allowed by the 889nm/18nm CH4-filter there is an important contribution of wavelengths with low CH4-absorption coefficient, namely those peaking at 878nm.
A simple measurement with Image J software shows that the total area limited by the blue line (889nm/18nm CH4-filter) in the right set of graphs is around 6x larger than that limited by the pink line (889nm/5nm CH4-filter), and also that about 50% of the area limited by the blue line corresponds to the “off-band” peak predicted to be centred at 878nm.
Accordingly, actual data from Jupiter images obtained
with these two filters back in 2004 show a difference of about 6-fold with respect to
three image parameters (total, maximum and average planetary flux). With respect to the
2009 data obtained so far, the differences in the above parameters have decreased to about
to 4-fold, perhaps to an ageing effect in the older 889nm/5nm filter. In practice this
means that currently I can grab a 1x1-binned 889nm/18nm CH4-image and a 2x2-binned
889nm/5nm CH4-image with the same integration time and get quite similar maximum as well
as average counts on both images (actual image data starts to be presented in the next
section of this page).

Rather than restricting the interpretation of the above filter behaviour to a poorer
performance/value of the 18nm filter with respect to that of the 5nm filter, I think that
the combined analysis of images obtained with both filters can be extremely interesting,
namely through the production of image-ratio data between two sets of images obtained at
similar date/time, or from “blink” time-lapses obtained from such images.
Besides, each one of these filters is able to produce per se a high-quality
“standard” methane-band image of Jupiter that can be very useful to
follow/enhance anti-cyclonic ovals, polar hoods, or impact events such as that recently
discovered by Anthony Wesley.
And for this type of single CH4-filter use, the 889nm/18nm is a winner since it produces
much better S/N ratio images with shorter integrations.
Going back to what appears to be the logic behaviour of these two filters on gaseous
planets like Jupiter, one may predict that the contrast (relative brightness) of high
altitude-clouds/haze will be higher in the 889nm/5nm filter (the albedo of deeper clouds
will be heavily attenuated due to the strong CH4-absorption coefficient at the pass-band
of this filter), and that the presence (or absence) of lower albeit methane-band
detectable clouds would be better probed by the 889nm/18nm filter (the slightly
“off-band” 878nm transmission peak will allow it).
Just a few examples. The high-altitude haze that
usually covers bluish festoons (NEBs projections) in the EZ would mask these when imaged
with the 5nm-filter, whereas the 18nm-filter would the able to show the absence of deeper
clouds/haze at the sites of (at least) the bluer/larger NEBs projections. In other words,
the relative contrast of festoons would be lower with the 5nm-filter. Another possibility
would be to probe high-altitude hazes over the GRS. Putative differences in GRS size in
images obtained with these two 889nm CH4-filters (e.g. smaller diameter with the
5nm-filter) could perhaps be correlated with higher-altitude clouds in specific regions of
that anti-cyclone. To probe for differences in limb-darkening, or for higher/lower than
average albedo differences in specific planet regions could also be interesting.
Go to next section of this page.