|
by Lorenzo Comolli - Written in November 2012 - Thanks to Giuliano Pinazzi for taking all the test images with his Pentax camera! |
Introduction
In this page you'll find a technical test. Please refer here for an introduction, details and testing method.
Available sensitivities:
Main results
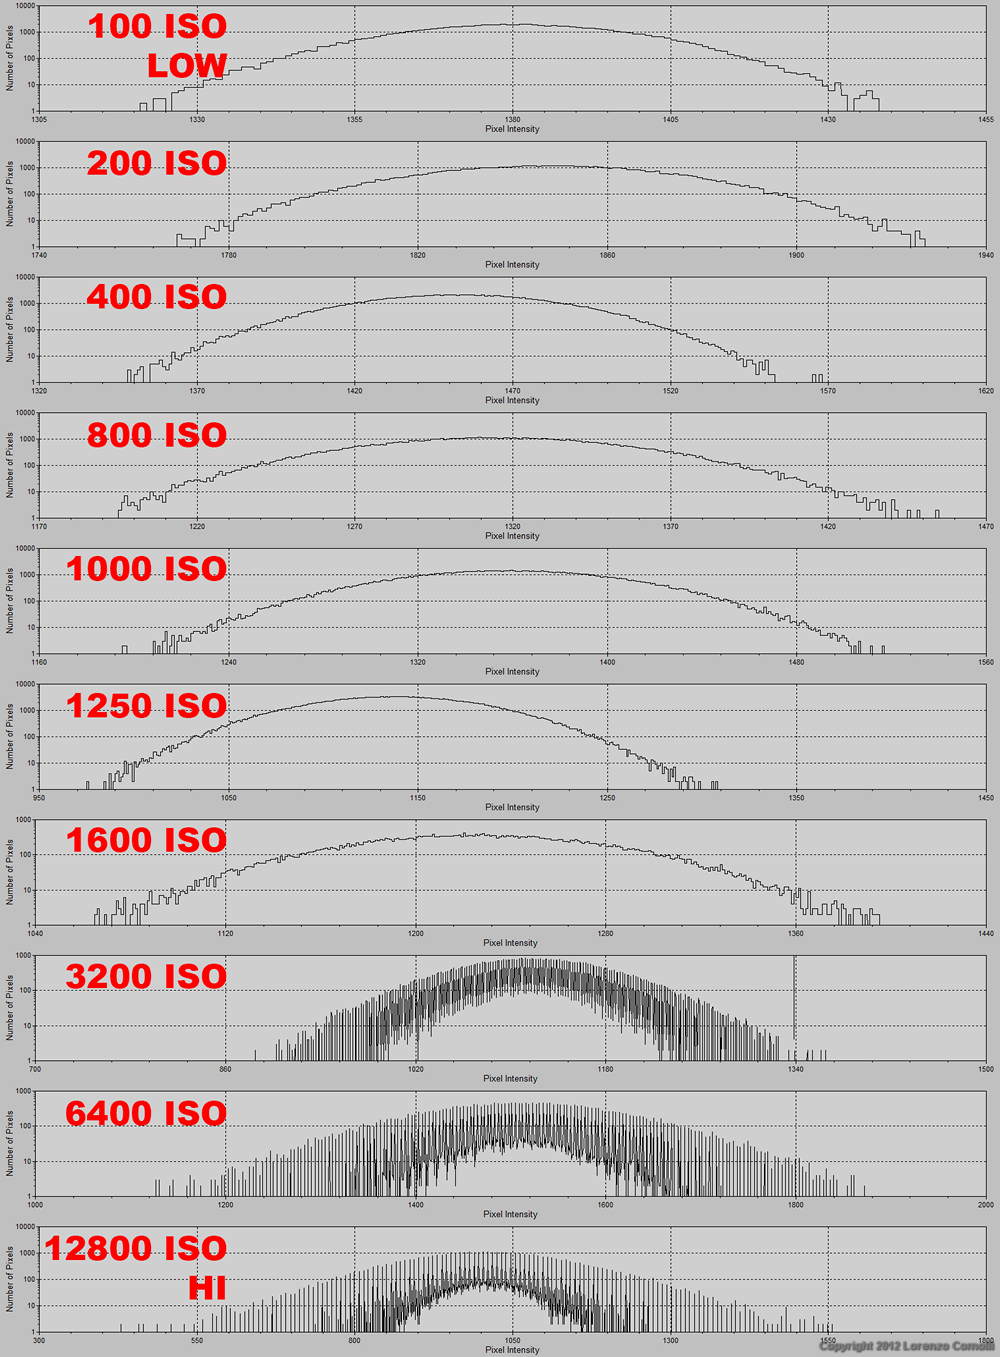
To distinguish between true and software interpolated sensitivities, the best method is to look at the histogram of a nearly uniform image (like a flat field). The result is shown in the figure below, and the conclusion is:
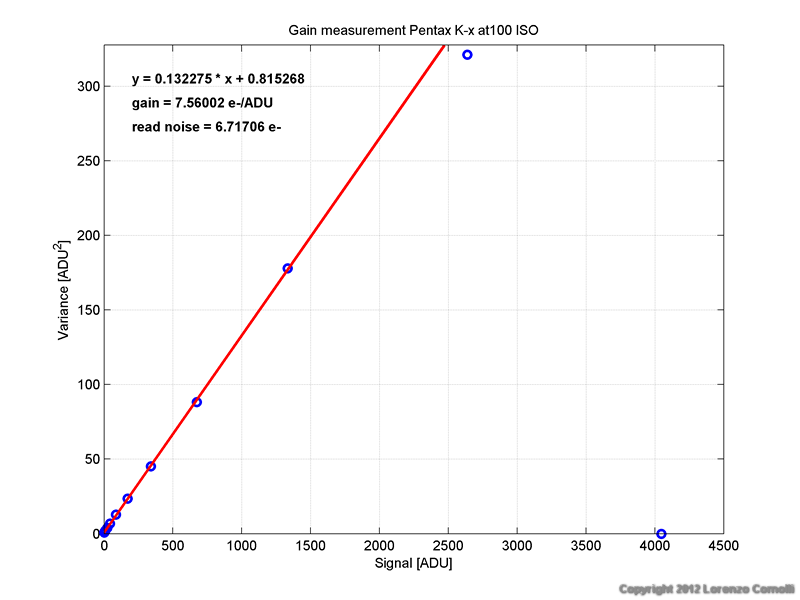
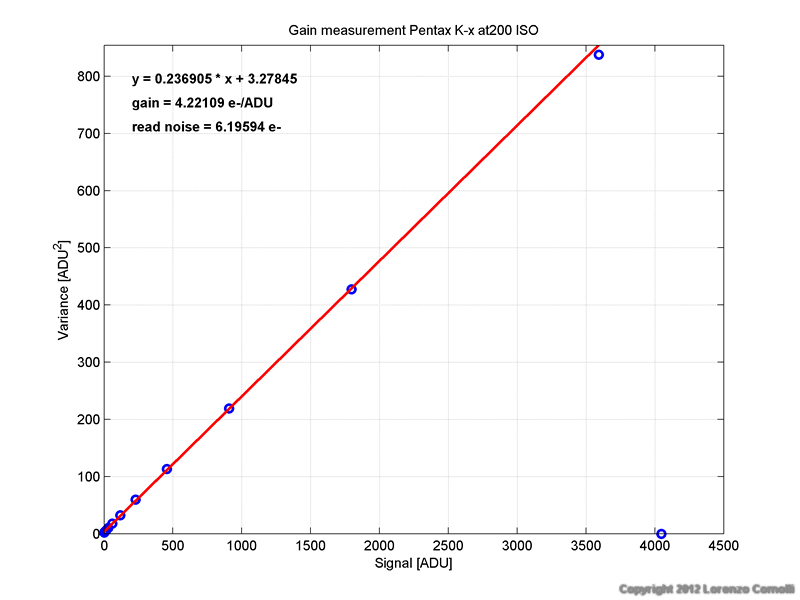
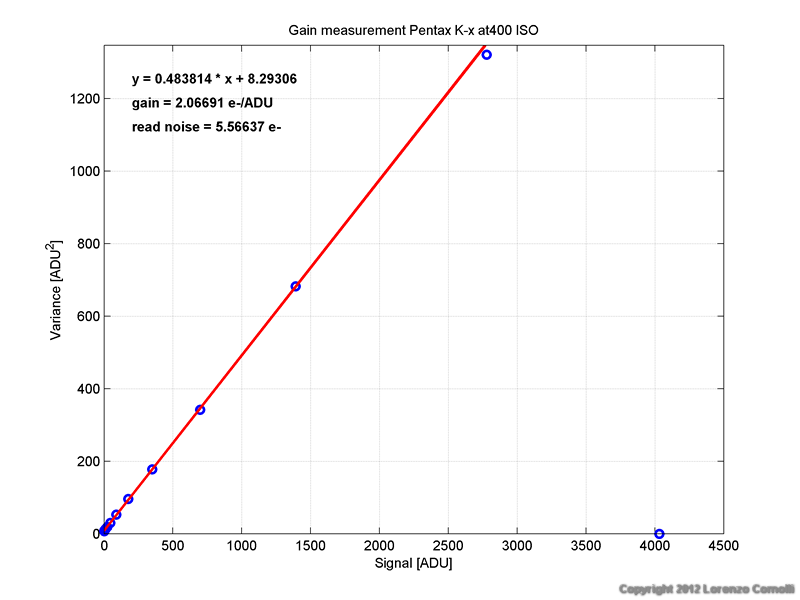
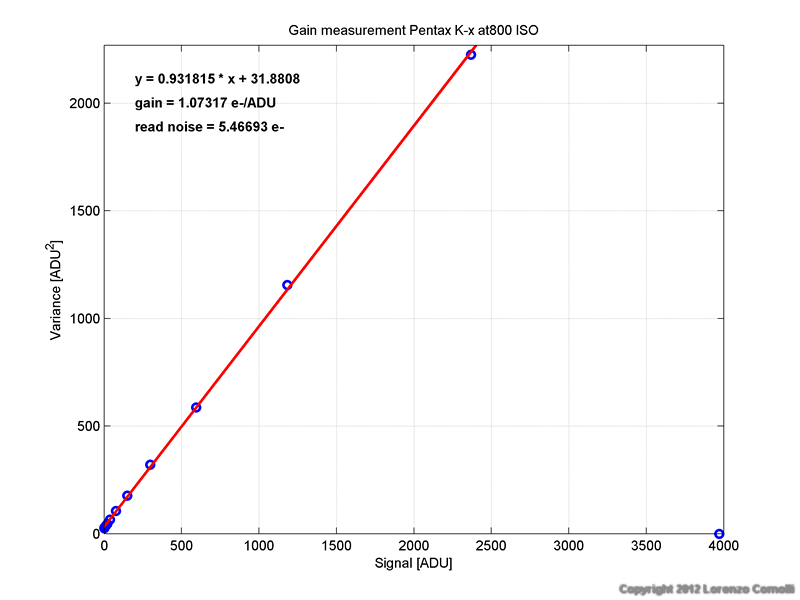
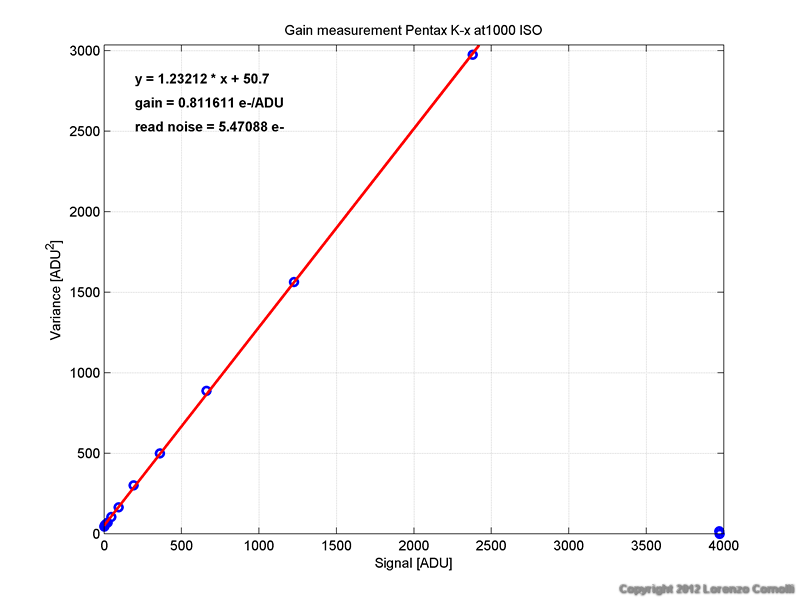
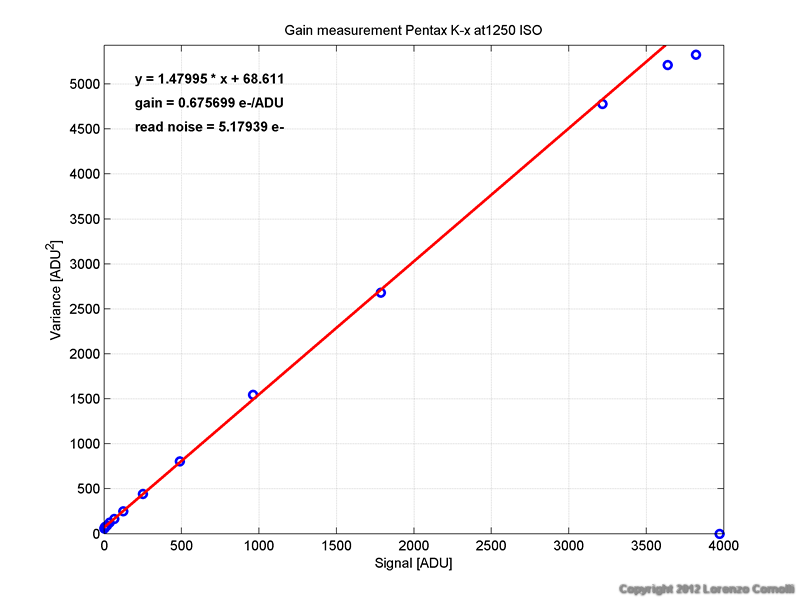
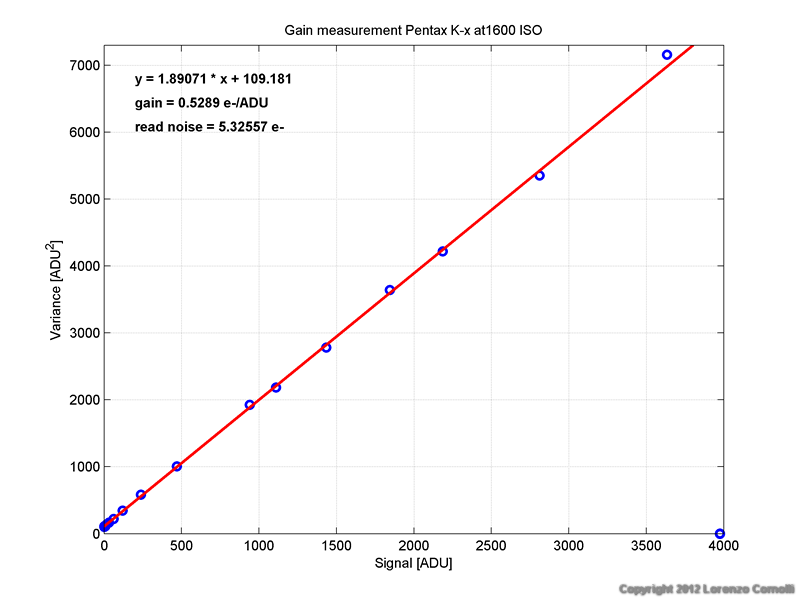
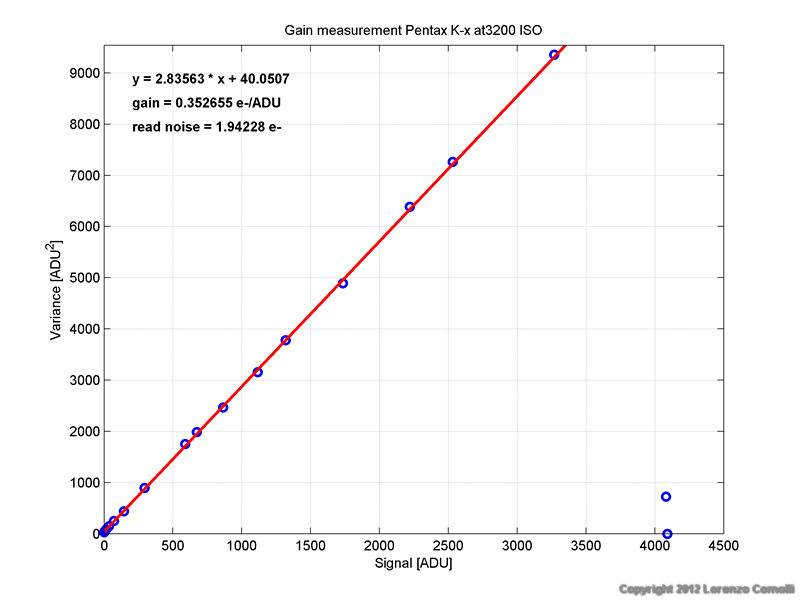
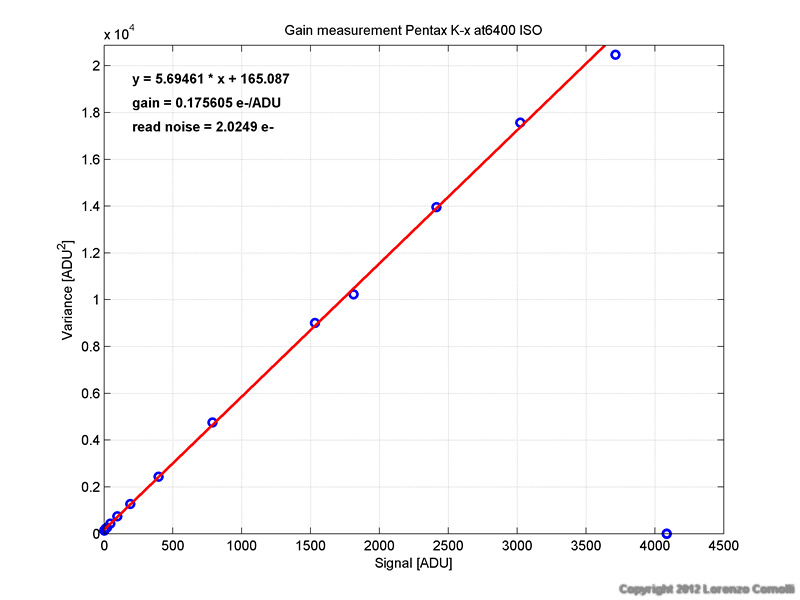
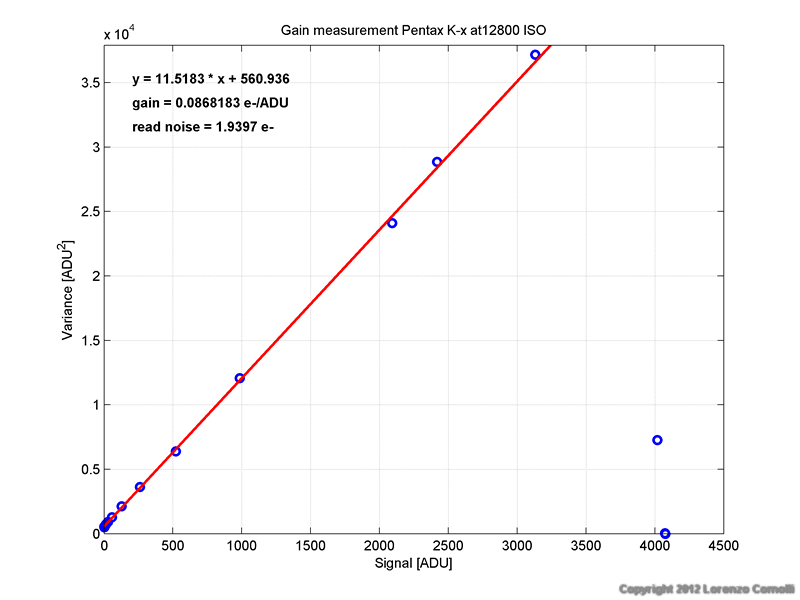
Gain and read noise
In this page you'll find a technical test. Please refer here for an introduction, details and testing method.
Available sensitivities:
- standard: from 200 to 6400 ISO with 1/3 EV steps
- extended: 100 ISO and 12800 ISO
Main results
-
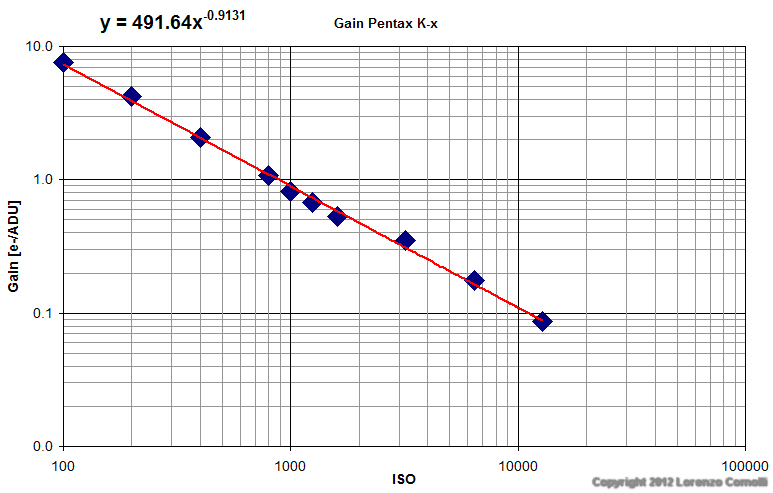
Gain. The measured gains
does not follow accurately the power law as can be seen from the graph.
Moreover the slope is not unitary quite noticeably. So 12800 ISO is not
128 times more sensitive respect to 100 ISO, but only 87.1 times!
- Unity gain at 887 ISO
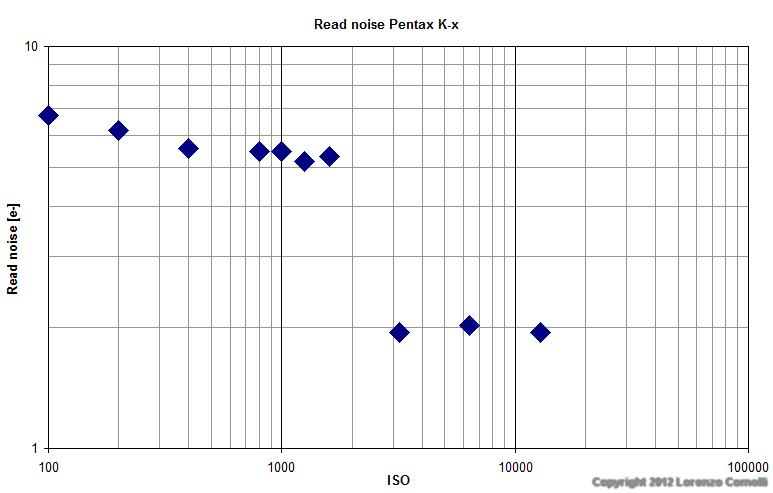
- Read noise. Read noise shows a very strange behavior.
- 200-1600 ISO: in this range the read noise in nearly constant, with only a small decrease at higher sensitivities. This can tell that the camera can be used at 200 ISO and software processed to be pushed at 1600 ISO (by 16x multiplication) without any noticeable difference.
- 100 ISO: it is strange to note that the read noise is not the same as 200 ISO, as expected because 100 ISO is an extended sensitivity.
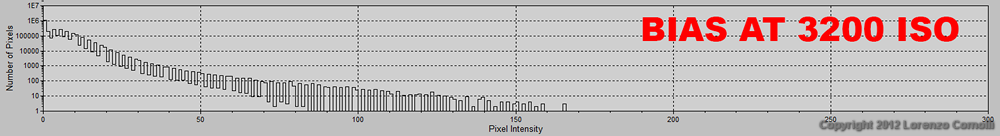
- 3200-12800 ISO: the read noise is (apparently) very small. But the
reason is clear when looking at the histogram of a bias frame, where
the blacks are clipped!!! Very bad behavior!!! Unusable when low light
sensitivity is needed such in astrophotography. Avoiding histogram clipping is the first rule when processing astronomical images, but being in-camera nothing can be salvaged.
- For
best results in low light circumstances, use 1600 ISO. However 400-800 ISO can be used with similar results.
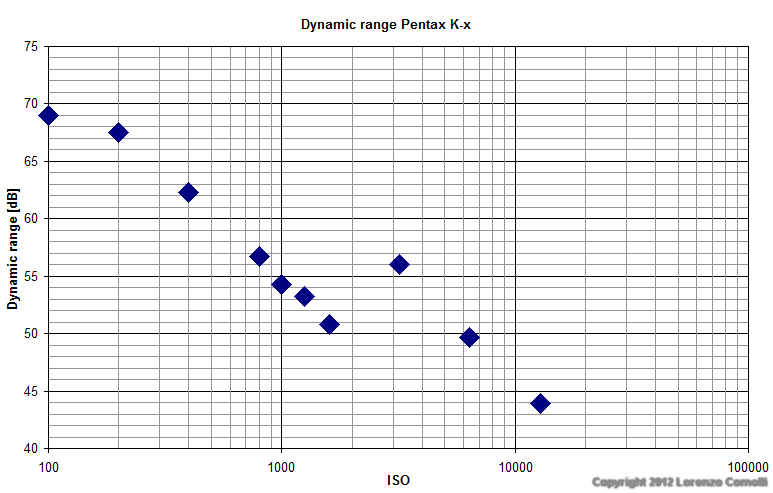
- Dynamic range. Considering
a full well capacity of 3500 ADU (except at 100 ISO, with 2500 ADU),
the approximate dynamic range is
computed and reported both in the table and graph below. The best
dynamic range
is at 100 ISO, and also 200 ISO has a similar value. Higher
sensitivities show much lower dynamic ranges. For best results on bright
subjects, always use only 200 ISO.
To distinguish between true and software interpolated sensitivities, the best method is to look at the histogram of a nearly uniform image (like a flat field). The result is shown in the figure below, and the conclusion is:
- 3200-6400-12800 ISO: surprisingly, not only 12800 ISO is an
extended sensitivity, but also 3200 and 6400 are not true!!! But they
are not declared as such, so this is a bad lie by Pentax. Moreover, at
the same sensitivities the histogram of a bias frame shows histogram clipping of
black pixels to zero ADU. This should never happen with good
electronics.
- Intermediate 1/3 step sensitivities seems to be true (tested only 1000 ISO and 1250 ISO) because they do not show any gap in the histogram. But looking at the read noise, 1000 ISO shows the same read noise of 800 ISO and 1250 ISO shows nearly the same of 1600 ISO. This, on the contrary, is a sign of not true sensitivity. Maybe these are false sensitivities corrected by internal software to show nearly no gaps in the histogram.
- 100 ISO has a reduced saturation level, as expected from an ISO extension on the lower side.
- 200, 400, 800, 1600 ISO are true.
Gain and read noise
| ISO | gain | read noise | Approx dynamic range |
| [e-/ADU] | [e-] | [dB] |
|
| 100 | 7.5600 |
6.717 | 69.0 |
| 200 | 4.2211 |
6.196 | 67.5 |
| 400 | 2.0669 |
5.566 | 62.3 |
| 800 | 1.0732 |
5.467 | 56.7 |
| 1000 | 0.8116 |
5.471 | 54.3 |
| 1250 | 0.6757 |
5.179 | 53.2 |
| 1600 | 0.5289 |
5.326 | 50.8 |
| 3200 | 0.3527 |
1.942 | 56.1 |
| 6400 | 0.1756 |
2.025 | 49.6 |
| 12800 | 0.0868 |
1.940 | 43.9 |
Histograms
Histogram of a BIAS at 3200 ISO (showing clipping of the blacks)