|
by Lorenzo Comolli - Written in January 2013 (updated March 2014) |
Introduction
In this page you'll find a technical test. Please refer here for an introduction, details and testing method.
Available sensitivities:
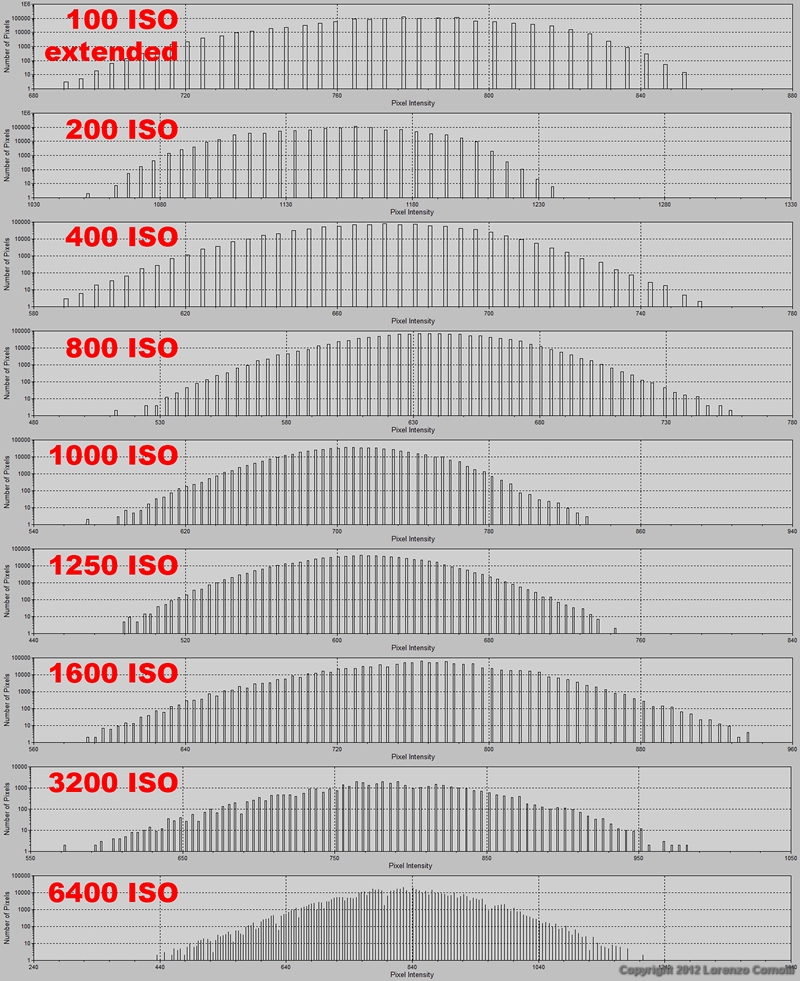
To distinguish between true and software interpolated sensitivities, the best method is to look at the histogram of a nearly uniform image (like a flat field). The result is shown in the figure below, and the conclusion is:
In this page you'll find a technical test. Please refer here for an introduction, details and testing method.
Available sensitivities:
- standard: from 200 to 3200 ISO with 1/3 EV steps
- extended: 100 and 6400 ISO
-
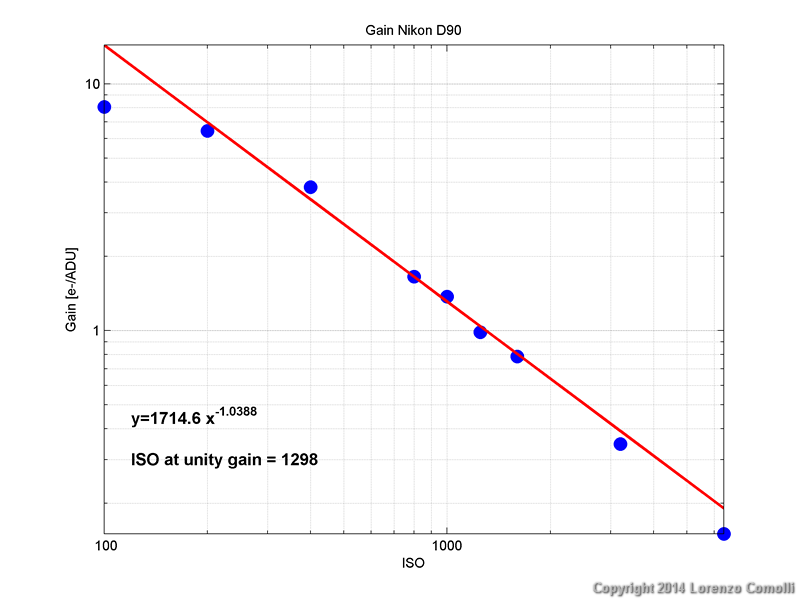
Gain. The measured gains does not follow accurately the power law. This may be connected to the difficulty of measuring the gain with the noise reduction applied to raw files by Nikon.
- Unity gain at 1298 ISO
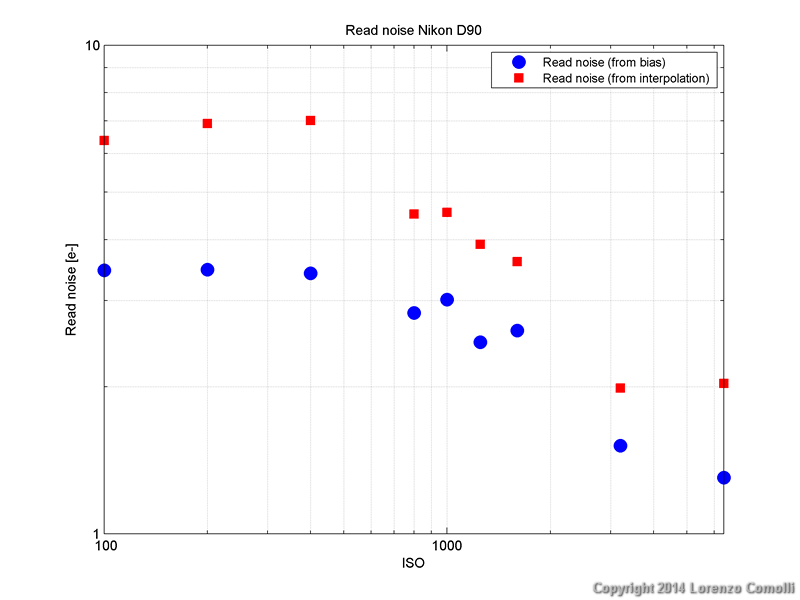
- Read noise. Read noise seems to remain nearly constant from 100 to 1600 ISO.
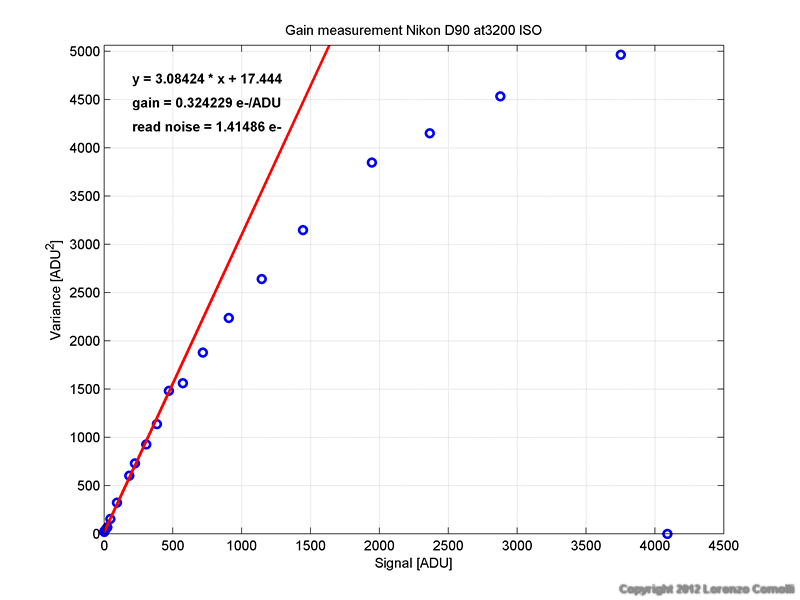
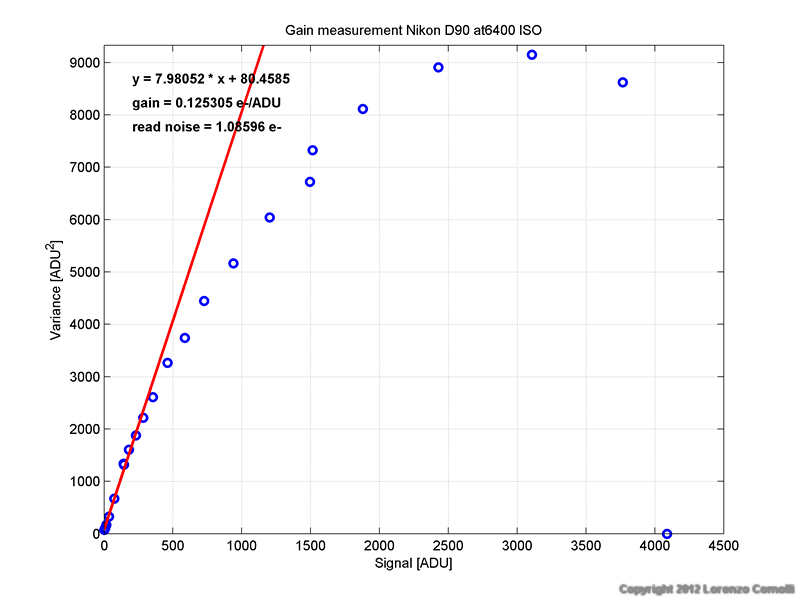
At 3200 and 6400 ISO the read noise decreases noriceably, nearly half of
the previous valuse: this is due to the "High ISO NR" that is applied
to raw data even if in camera the option is set to zero. This behaviour
is very bad and is admitted by Nikon as can be read in the manual (pag. 168, High ISO NR, Option Off, Noise reduction is only performed at sensitivities of Hi 0.3 and higher). In truth the manual forgot to declare that NR is performed also at 3200 ISO (as corrected in the manual of newer cameras).
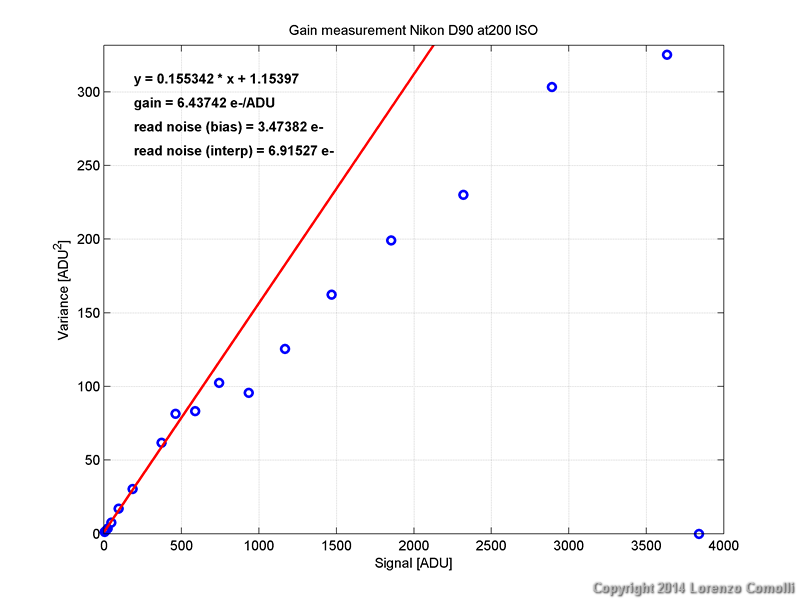
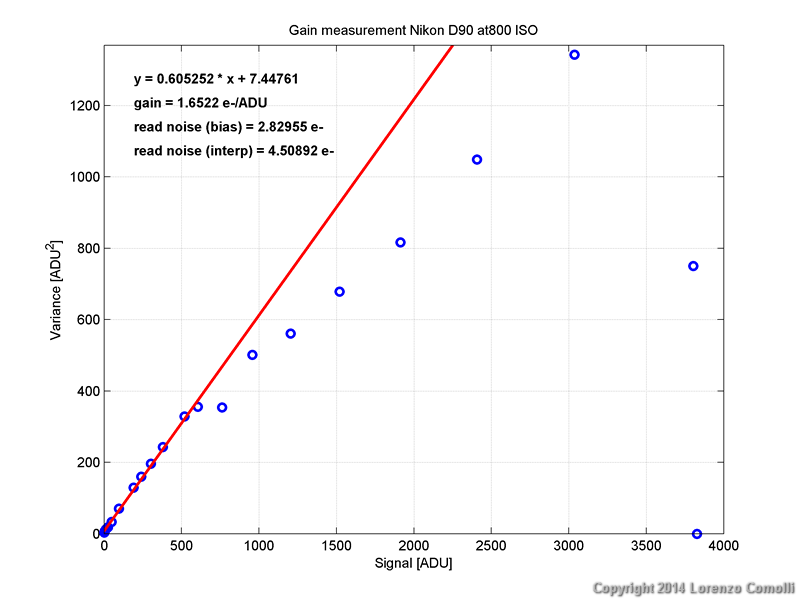
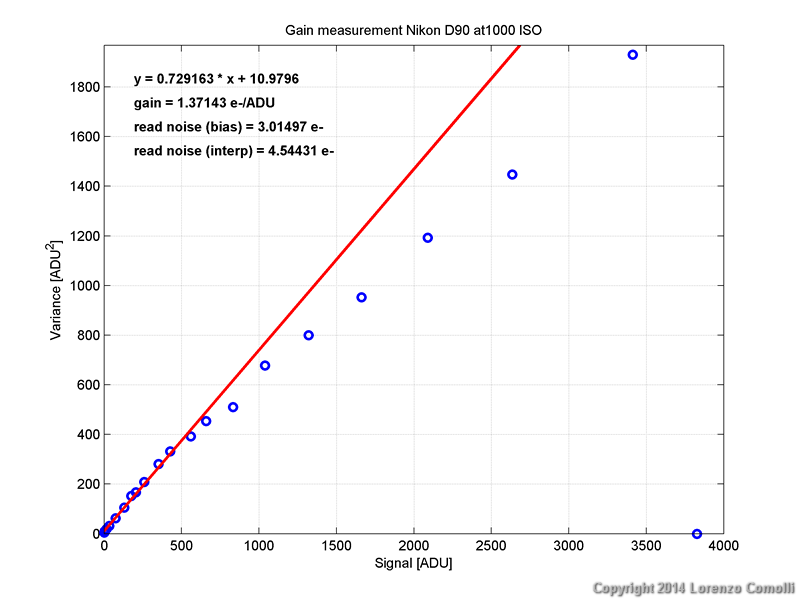
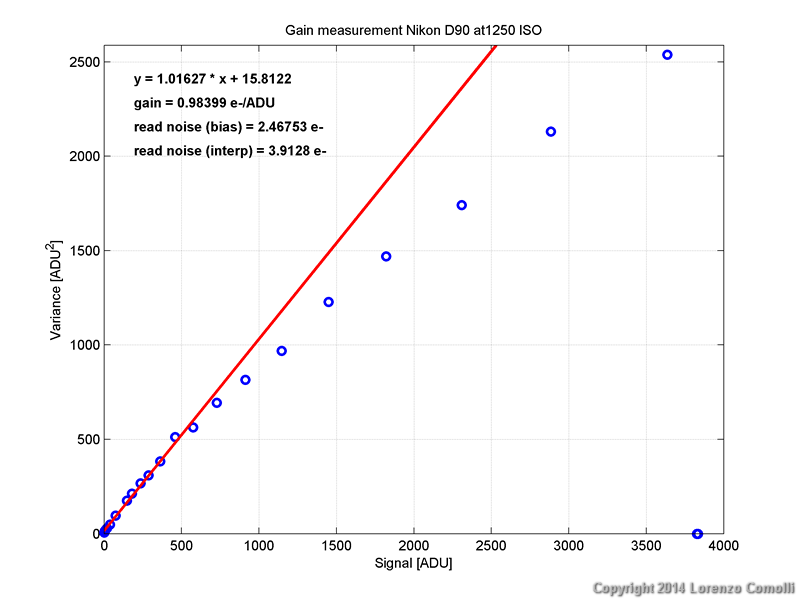
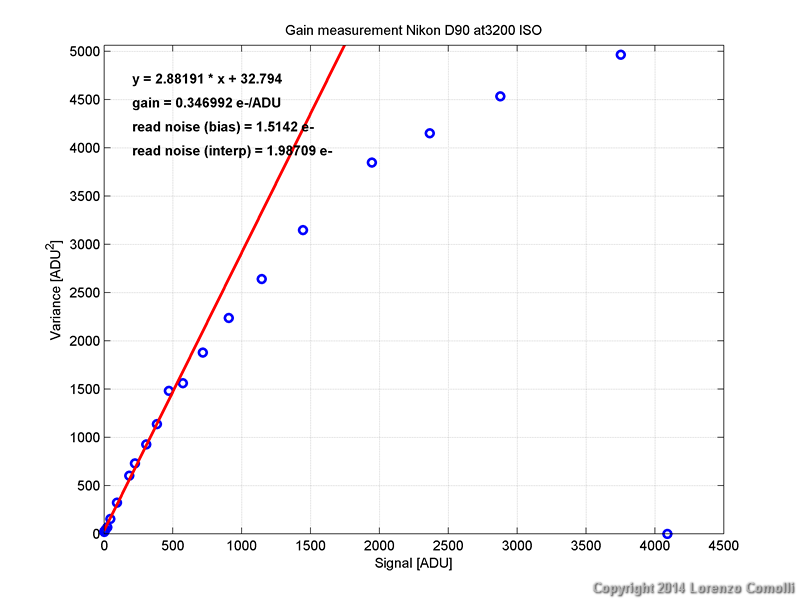
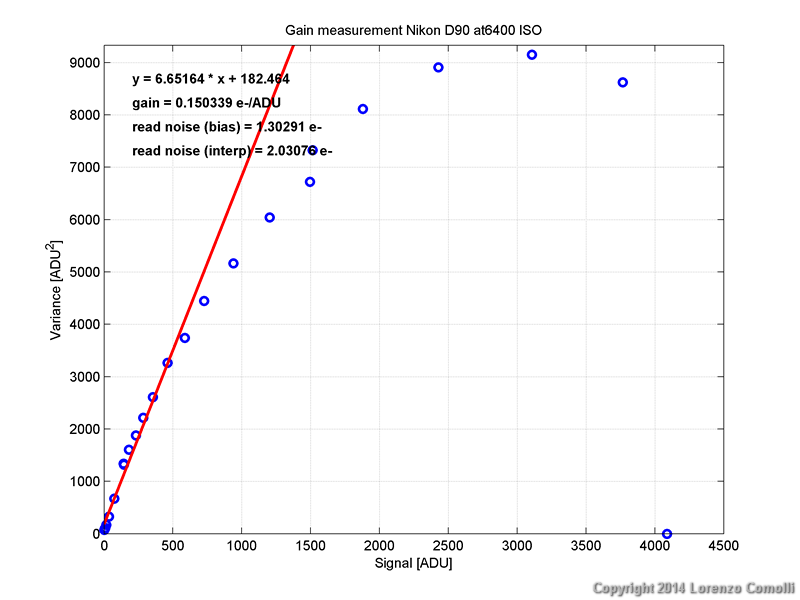
However another kind of noise reduction is applied to all ISO: black level clipping, i.e. no offset is applied on ADC readings, as should be is good data acquisition, and as Canon performs. So it is impossible to measure the true read noise and this explains why Nikon cameras appears with less noise respect to competitors. To measure the read noise a more complicate method has to be applied, as you can find here below. The read noise is estimated from the interpolation of the gain curve. In the graphs below, the red points (from interpolation) are the better estimation of read noise and dynamic range.
As a final note: the behavior of Nikon of performing NR and black clipping on NEF raw data is to be deprecated, because this do not allow to access the raw data. Consequences are: (1) no good measurement of noise can be performed and so no comparison can be made with other brands; (2) NEF cannot be be used for scientific work.
For best results in low light circumstances, mainly use 1600 ISO. Avoid 3200 and 6400 ISO due to the heavy noise reduction.
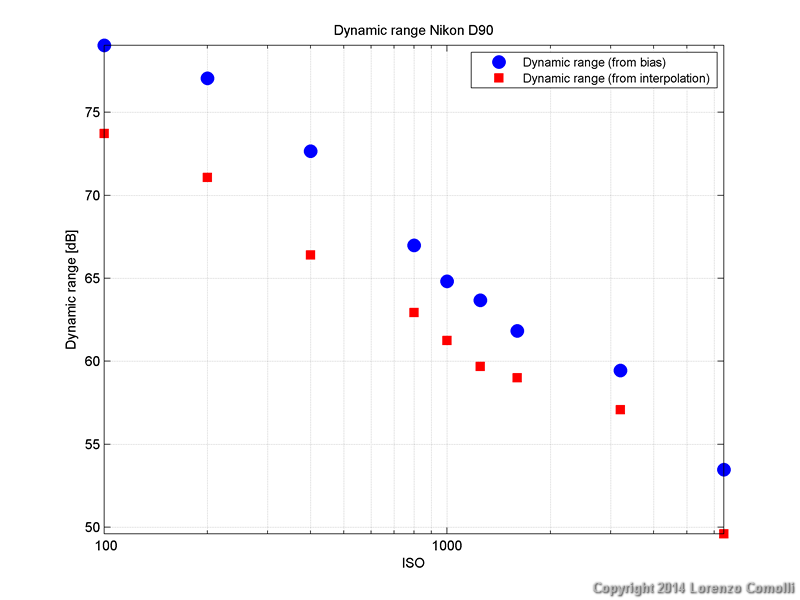
- Dynamic range. The dynamic range is computed and reported both in the table and graph below. See above for comments about the reliability of these measurements; the true values can be significantly lower. The best dynamic range is at 100 ISO, but also 200 has a similar dynamic range. For best results on bright subjects, use 200 ISO or less.
- Linearity. Looking at the gain measurement plots, a highly non-linear behavior
is noted. However the linearity plots (not shown here) are linear. So
what is the reason? I suspect that Nikon firmware apply a stronger
denoise to bright tones, i.e. above ~15% of the dynamic range.
That's why I've measured the gain interpolating only in the lower part
of the gain measurement graphs. This is the first time I find a DSLR
with such a behavior (previously I've tested only Canons and a Pentax
camera). That's a shame that the NEF files does not contain true RAW
data.
To distinguish between true and software interpolated sensitivities, the best method is to look at the histogram of a nearly uniform image (like a flat field). The result is shown in the figure below, and the conclusion is:
- RAW DATA IS 10 BIT and not 12 bit as the Nikon specifications state.
This is a very bad discovery, that was not known to the photographers;
only a very few and marginal posts can be found online googling for
this. If I would discover such a thing on a camera of mine, I would have returned the camera and asked for a pay back. :-(
- As a conclusion, none of the available sensitivities are found to be real. Very bad.
| ISO | gain | read noise (from interp) | Approx dynamic range |
| [e-/ADU] | [e-] | [dB] |
|
| 100 | 8.0673 | 6.3811 | 73.7 |
| 200 | 6.4374 |
6.9153 | 71.1 |
| 400 | 3.8140 | 7.0136 | 66.4 |
| 800 | 1.6522 | 4.5089 | 62.9 |
| 1000 | 1.3714 | 4.5443 | 61.3 |
| 1250 | 0.9840 | 3.9128 | 59.7 |
| 1600 | 0.7852 | 3.6068 | 59.0 |
| 3200 | 0.3470 | 1.9871 | 57.1 |
| 6400 | 0.1503 | 2.0308 | 49.6 |
Histograms
Details of measurements at each ISO setting