

 Curve plotting
 Generalities
| JEphem Presentation Ephemeris SkyMap Curve Date search Informatic Library Download Glossary About | |


|
JEphem
 Curve plotting
 Generalities
|
| Generalities | |
|
To handle Curve plotting, two classes were developed :
jephem.tools.Curve, handling the core curve functionnalities and the display (it is a subclass of JPanel).jephem.gui.CurveViewer, which handles the commands |
double arrays. The display is done from discrete values. Typically, 100 values are enough to get a continuous impression on the screen.
Curve API can display several curves on the same drawing, it needs one double array per represented curve.double[][], accessible via getData().
Curve via the constructor (see Curve javadoc).
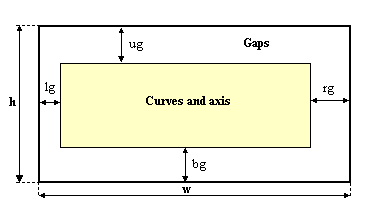
public int getNbX() permits to retrieve the number of values used to represent each curve.public int getNbY() permits to retrieve the number of represented curves.getXMin(), getXMax(), getYMin(), getYMax() are also available.public double[] getX(), to get the X values.public double[] getY(int whichY), to get the values of the whichYth curve.public double[][] getAllY(int whichY), to get the values of all the curves.getY(int whichY, double x) permits to retrieve the ordinate corresponding to x for th whichYth curve. An interpolation is done if x does not correspond to one of the pre-calculated values (see interpolation).Curve. It is organized like this :

tg, lg, bg, rg.
Curve.
| xD | xP |
|---|---|
| xMin | lg |
| xMax | w - rg |
| yD | yP |
|---|---|
| yMin | h - bg |
| yMax | ug |
pixelToData() and dataToPixel().


|

|