Spectroscopy
Spectroscopy consist on the decomposition of light (or other
electromagnetic radiation) in its constitutive elements (spectrum). A real
example is the rainbow, a low resolution spectrum of solar light.

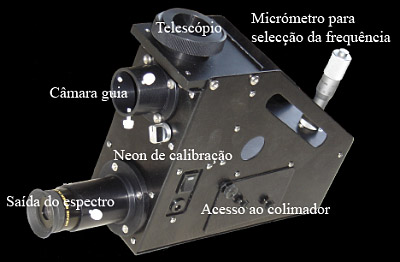
The spectrograph is the device that contain the element that disperse the light, usually a diffracting grating, combined or not with a prism. By changing the angle of the grating to the optical axe, the wavelength of the spectrum is changed. Concerning my spectrograph, shown at right, the light from the telescope focus in a slit of 25 μ located between the two outputs, pursue to the collimator where the beam is made parallel, goes to the diffraction grating, it is reflected by it, passes again through the collimator, which in this case will focus the diffracted beam at the ocular, or CCD.
Why spectroscopy in astronomy? Using this technique we can determine with precision the spectral class of the stars, its metallicity, as well as its evolutionary state; We can study and follow the behaviour of variable stars; we can study the movement of the celestial bodies with the Doppler effect; we can study the chemical composition of the planetary atmospheres and of nebulae; We can accurately study the solar chromosphere; We can visualise by indirect methods of Doppler tomography near binary stellar systems... and many more applications.
At amateur level, we are limited to the weak power of light gathering of our telescopes, with apertures seldom greater than 250mm. The higher the dispersion of the received light, the lower the light attaining each pixel of the CCD. This fact limits the objects available to study. In my case, using a Schmidt-Cassegrain of 235mm aperture, with a diffraction grating of 2400 lines per mm (dispersion of 0,116 Å per pixel) I'm limited to a magnitude of 6,2 in the Ha zone to point objects, for an hour exposure. With the diffraction grating of 300 lines per mm (dispersion of 1,49 Å per pixel) I manage 10,3 magnitude. To understand how a spectrum is processed, follow this link.
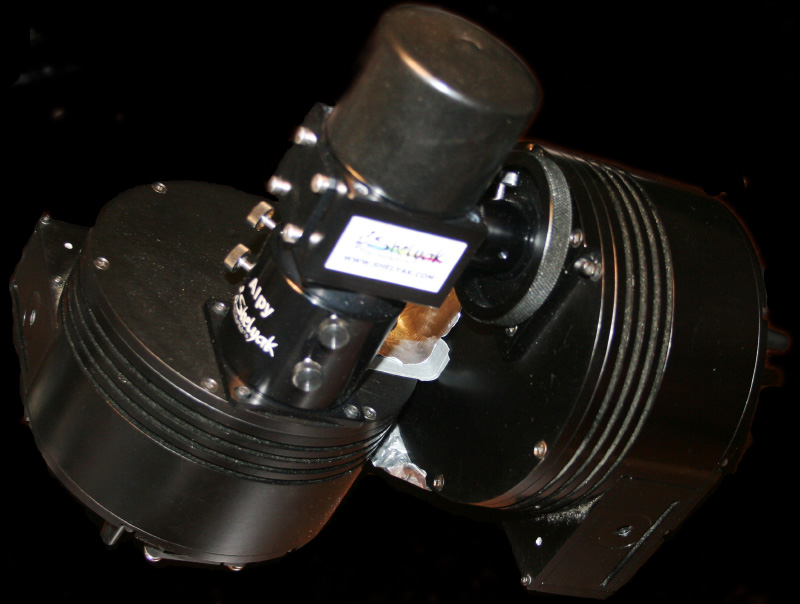
In mid 2013 I complemented my scientific equipment with a R=600 spectrograph, the Alpy600:

With this equipment I can cover all the visible and near-infrared wavelengths up to 14 nag.
To know more about these spectrographs, follow this link
In all spectral graphics, wavelength in Å in abcisses and flux or normalized flux in ordinates.