Method for the extraction of data from the acquired images
After developing the method for the acquisition of narrowband images of the Moon with enough resolution and a good signal-to-noise ratio, procedures must be found for the interpretation of the results. A probable method advanced by Filipe Alves, consist in the determination of the ratio between two images, one corresponding to a spectro-selenogram of a precise wavelength and the other the result of the average of all spectro-selenograms contained in the acquired spectra. In order to better understand the aim of the method, let's see the follow example:
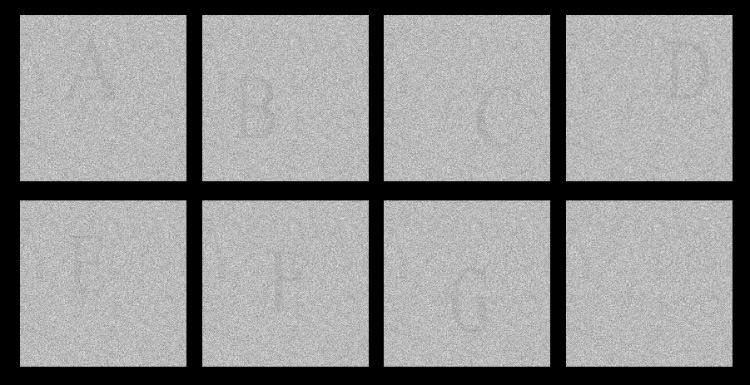
The figure above simulates a series of "narrowband" images all different in some details , in this case represented by letters. The image at bellow-right contain a white "A" nearly at the same position of the black "A". The average of these images results in an image without the details of each individual image:

The image above correspond to a "broadband" image containing all the contributions of the acquired spectra.
Performing a ratio between each "narrowband" image and the "broadband" image, one manage to show the differences of the two images, nullifying the common parts:

In the figure above, the left image correspond to the ratio between the black "A" and the average and the right image correspond to the ratio between the white "A" and the average. The "narrowband" image details become evident.
In practice:
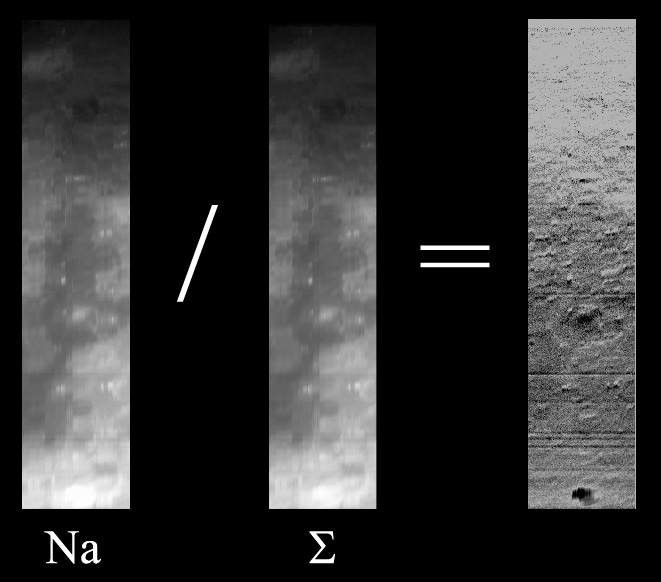
The lunar zone represented above goes from Lalande to near Pitatus, passing by Birt. The left image correspond to a wavelength centred in the Sodium doublet and have a bandwidth of 3.4 Å. The central image result from the average of all acquired wavelengths (broadband image), and the right one is the ratio between the other two. In the right image, zones without detail correspond to zones without differences between the narrowband and the broadband images. The dark spot bellow show a difference, in this case, by defect of the colour corresponding to the wavelength centred at 5893 Å.
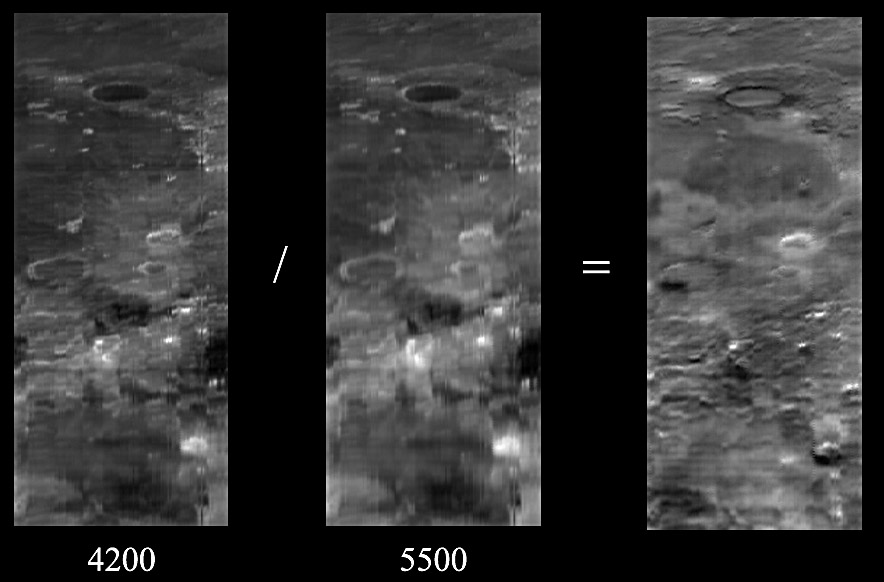
This method may be interesting in the study of colour-index as an image, such as the C(0.42/0.55µm) to estimate the TiO2 abundance (Charette et al., 1974):
If Filipe Alves method for enhancing the colours of the Moon is applied, one can compare the results of both methods. From the literature we know that in the coloured Moon the brown is related with more Iron Oxide concentrations and the blue is related with more Titanium Oxide concentrations.
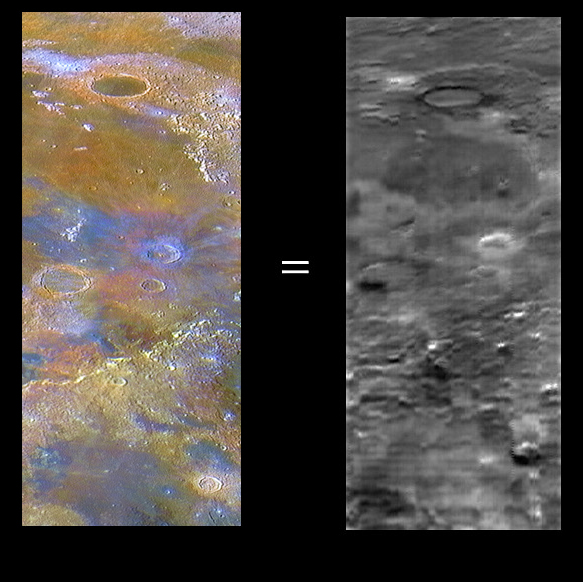
The image above represents the same region in the Moon. The left one is a coloured Moon image and the right one is the colour index C(0.42/0.55µm). One can see clearly that the blue zones in the left side correspond to the lighter zones in the right image, related to a higher concentration of TiO2.