|
|
|
Composites by Examples If we observe the Sun through an interferential filter centered on the Hydrogen-alpha line with an half bandwidth of 0.5 Å, we see stationary features in this light, structures steady, without components moving inward or outward. However if we adjust the filter 0.5 Å to the red wing on the line, we can see features going away from us. If we adjust the filter 0.5 Å to the blue wing of the line, then we see structures coming in our direction. This technique can easily be explained. If you filter has a passband of 0.5 Å, red and blues images have to be at 0.5 Å each side of the central peak of the line. This is the only way to get the maximum colored effect without missing details. In the case of the Hα line, a Doppler shift of 1 Å in the center of the line represents a moving of around 45 km/s on the Sun surface. So when we look at the Sun using an interferential filter, we have to observe both wings of the line, in addition to the central peak, in order to see the complete activity of a solar active region. Otherwise, structures with high speed motion will not be recorded or only partially. The RGB composite picture will present a passband equals to around three times the filter passband, improving in the same occasion details on the Sun disk much better than a single monochrom picture.
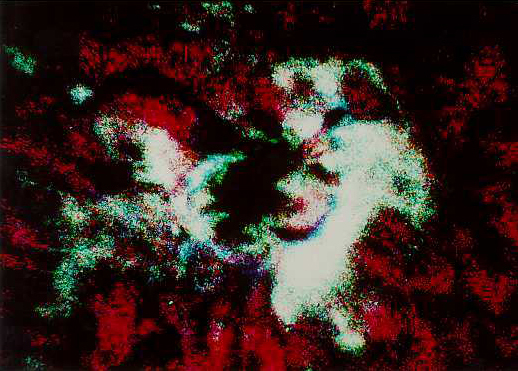
Instrumentation To create his Hα composite, Carey Fuller used a 105 mm f/17 scope installed at Culgoora Solar Observatory, Australia. The wavelength shift is adjusted manually by rotating the filter. The scope used a photoelectric guiding system and an electronic reflex camera. At focus the Sun image was 17 mm in diameter which explain the slightly grainy color image. The original B/W pictures were taken on Kodak TP 2415 and Kodalith Pan 2568-SP 417 film. Time interval between the three pictures was 10 sec. in order to minimize the motion of solar structures. Time intervals over 1 minute between each picture are much too long, mainly picturing loop and prominences. In theory the best solution should be to take the three snapshots simultaneously but this solution requires three colored filters mounted in a wheel which does not exist for such application and an interferential filter which temperature and tilt are quickly adjustable. Then negatives are developed in D-19 for 3 to 6 minutes at 20°C. Take care to seeing variations when you take your three B/W pictures because unstable source images will never produce a useful tricolor Hα image; there will be always an exceed of red and blueshifts and bright white zones in your composite which interpretation will not be conform to the reality. So select your negatives with care. Now we have two possibilities to process these raw images : either we use the classic argentic method - what we will do for the example - or its computerized counterpart by scanning and processing these images in an IP software to create a RGB composite as explained previously. This second technique is of course easier to set up. Darkroom processing Using the old fashion way, the best negatives are then copied onto the same film to get B/W positives slides you can enlarge on 4x5" sheets if you like. Selected portions of these slides are then projected in a reflex camera body used without its lens on a TP 2415 film. These images are then developed in D-19 and mounted like slides. To create your composite, you must use three small and identical projectors as compact as you can and able to alter the image geometry in all directions as the images will not be projected the same way on the screen. Their optical axis will be the most parallel as possible. Now, cover all bright surface with a dark cloth and switch the light off. The best way to combine the three B/W images is creating a positive composite using RGB filters as explained earlier : - A red filter W25 is added to the Hα image shifted to the red wing of the line - A green filter W61 is added to the Hα image taken in the central peak of the line - A blue filter W47B is added to the Hα image shifted to the blue wing of the line The blue projector will be set at its maximum brightness while the green and red ones will be reduce to balance colors. As some solar features may request a peculiar study, you can still adjust the light intensity according the color saturation you want to improve these features. With flocules white balanced for example, zones slightly outside active regions will be displayed in magenta (red + blue) because these quiet zones have less absorbing in the central peak (green). But you can also balance these quieter zones in neutral gray which will give flocules a green color. At last, picture the projection of the RGB tricolor images on a very fine grain emulsion (because this is your second enlargement from the original) like the Kodachrome 25 with a 105 mm f/2.5 lens, 20 sec of exposure. Images interpretation Other colors than pure RGB and their mixing can be produced, depending on the filter passband and the wavelength separation used for the each B/W image. In our example, RGB colors are respectively associated to features going away from us, stationary and coming to us. Other colors result of motion combinations. The next drawing, showing the additive colors synthesis will help you to understand this concept.
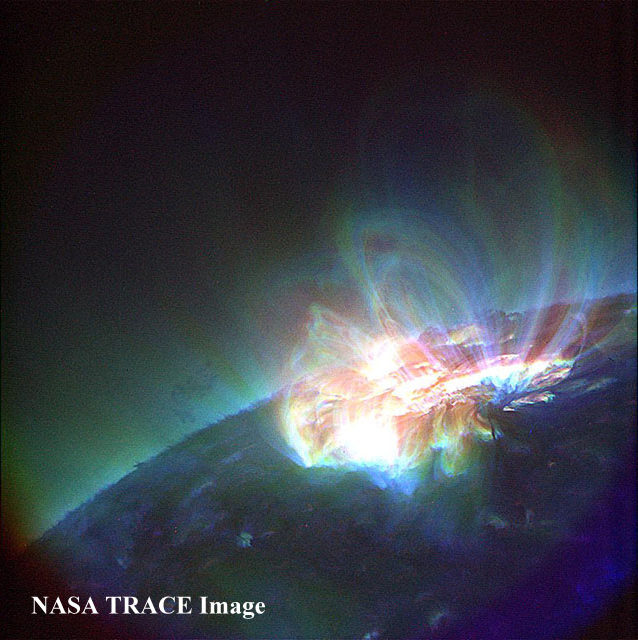
In respect with the optics laws, as we use the additive colors synthesis (RGB) to create our composite, sunspots display a red emission toward the Sun limb and a blue emission to the center of the disk because they have a radial component to the outside, near the sunspot penumbra, this is the Evershed effect : the plasma comes out the umbra to fall out near the penumbra at a speed of 1-2 km/s (cf. J.Evershed, 1909; J.H. Thomas, 1994; T.Rimmele and J. Marino, 2006). Most filaments show colorations depending on their dynamics. The yellow color is produced by a red + green lights, that means these features have a lower doppler shift to the red portion of the spectrum than the red color. A yellow tint on the limb can also be the result of a feature including both stationary emissions (green) and a redshift (red) in the central peak. Idem for other colors. On the limb, colored images of dynamic phenomena like eruptives prominences, coronal eruptions and loops are obvious : those structures are observed in emission on the sky background (blue, green or red).
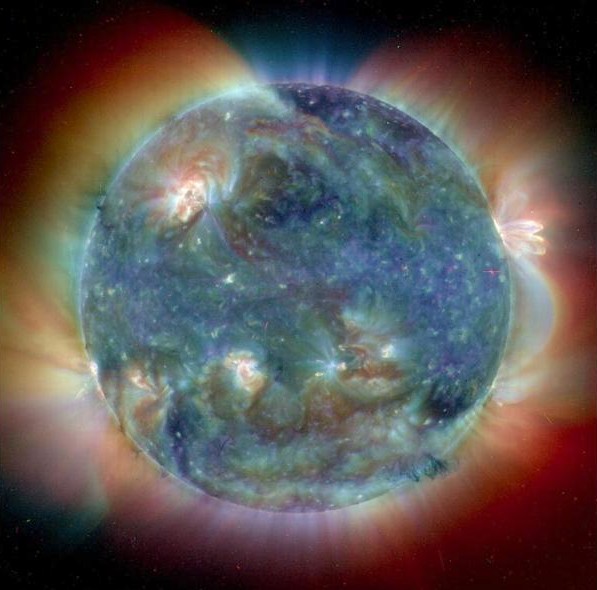
However, if the interpretation is quite obvious for a picture of the solar limb, the disk image interpretation is much difficult. As we observe through a thicker layer in the solar chromosphere, some features are in absorption while others are emitting. Sometimes those structures are simultaneously absorbing and emitting or multiples phenomena evolve on the same side of the wing of the Hα line. At last it is good to know that absorbing features display colors which are complementary to emitting color features which evolve at the same speed in that light. Take a example. A dark filament blueshifted can appear in yellow in Hα-trichromy if the blue light has been absorbed. On the opposite, a very bright feature like a flocule, when observed in emission will display a color directly depending on its speed in that light. As you see, tricolor imaging gives a much more complete picture of the solar structures status than any B/W image and reveal "dynamics" of active solar regions, word that finds here its true meaning. In a B/W picture, structures in motion are often partially recorded because the matter is redshifted outside the filter passband and cannot appear on the picture. So this technique offers you a real opportunity to see the motion of solar masses. In this tricolor technique, there are three balance to adjust between the images contrast, brightness gradient and color saturation of solar features. Narrow band filters (0.2-0.7 Å) offering a very accurate wavelength separation will be more useful to study solar structures evolving slowly, while filters showing a large passband (over 0.5 Å) or able to shift their central peak quickly will be more suited to record loops, eruptive events that move quickly through the passband of the filters. However, to get good color composites the filter symmetry should be accurately fixed. A photometric device will help you in this task. At last, you can get tricolor composites of this kind not only in Hα light but also in number of other lines. Tricolor composites can also be performed in H-beta, H-gamma, Ca-K or Na lines and could offer some revelations to the amateur ready to build an instrument suited to this peculiar activity. Spectroscopic application : Doppler imaging. If you are tired of using complex processes to get tricolor pictures, here is a convenient method that provides results as good as isophote technique. The method is simple and does not take care of patience and skills you took in getting good originals ! It is also fast and can be completed in a few seconds.
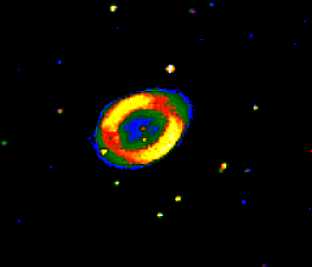
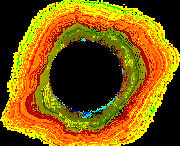
For these examples I played on balance, modifying the color saturation and contrast, and pushing drastically the gamma to 0.5. Then an edge (contour) function and a color inversion was applied to get these false colors. The results are far to be bad and enhance details of these subjects. I specially thank Fred Espenak, Carey Fuller, Kazuyuki Tanaka, Okano Kunihiko and Jerry Lodriguss for their help in writing these pages. For more information Don't be afraid of CCD (on this site) Imaging software reviews (on this site) Basic Concepts in Digital Image Processing, FSU CCD Astrophotography wih a 3.5" Questar, R.Vanderbei 1001 Links (letter M, Manufacturers and S, Image processing Methods) Books about Image processing The Deep-sky Imaging Primer, 3d edition, Charles Bracken, Deep-sky Publishing, 2022 Capturing the Universe: A Photographer's Guide to Deep-Sky, Chris Woodhouse, CRC Press, 2020 Lessons from the Masters: Current Concepts in Astronomical Image Processing, Robert Gendler, Springer-Verlag, 2013 Capturing the Stars: Astrophotography by the Masters, Robert Gendler, Voyageur Press, 2009 The Image Processing Handbook, John C.Russ, 1999/2006 The Handbook of Astronomical Image Processing, Richard Berry, Willmann-Bell Publishing, 2006 Introduction to Digital Astrophotography, Robert Reeves, Willmann-Bell Publishing, 2004 Photoshop for Astrophotographers, Jerry Lodriguss, 2003 The New CCD Astronomy, Ron Wodaski, 2002 Photoshop Restoration & Retouching, Katrin Eismann, Doug Nelson, 2003 Astrophotography: An Introduction to Film and Digital Imaging, H. J. P. Arnold, 2003
|
|||||||||||||||||||||||||||||||
|
|
||||||||||||||||||||||||||||||||