|
Software review
|
|
|
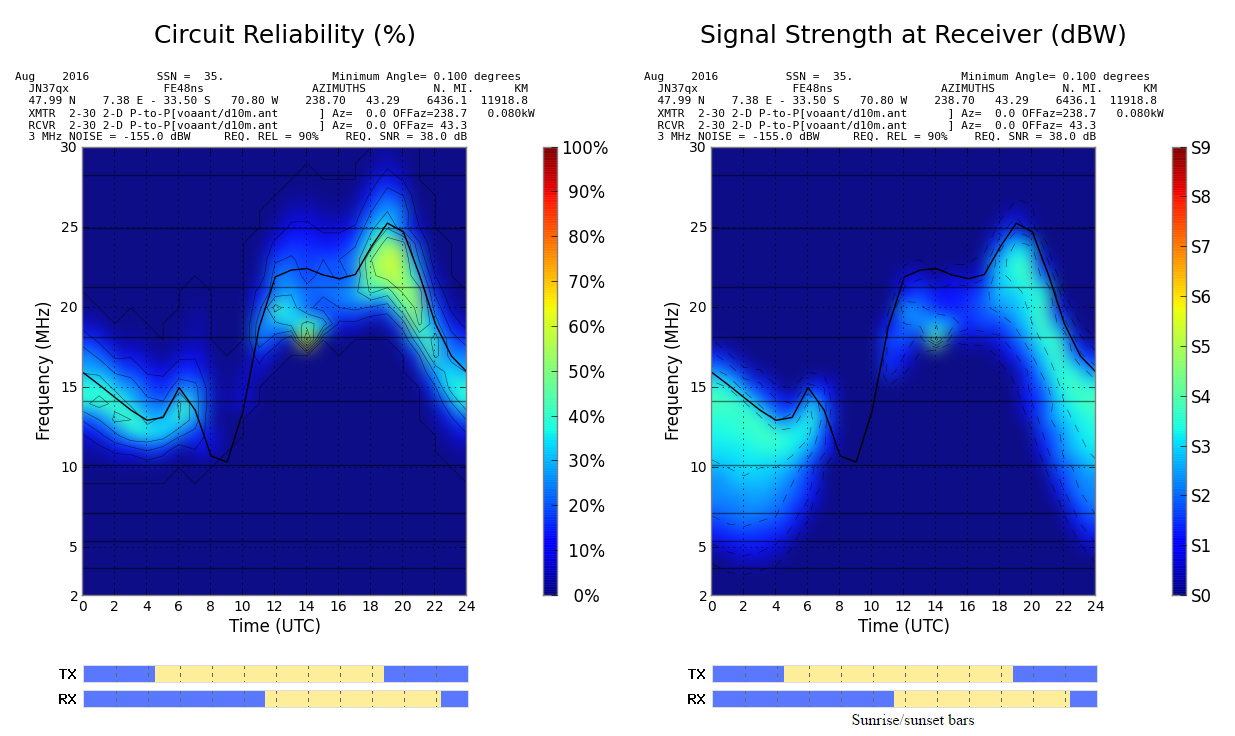
Signal-power-at-receive
forecast (73 dB reliability, thus "good") for an SSB circuit between
LU and ON on August 2004. We can already conclude
that it is better to work at night to get a signal
over S4 (-130 dBW) on 20m. Other charts predict a SNR of 34 dB.
And indeed, in the field signals were readable at the
predicted time and frequency. |
VOACAP
propagation analysis and prediction program (IV)
Forecasts
and outputs
When
all data are entered, you can at last request a forecast. That means
first to calculate the propagation (via the "Run" dialog) then
display the output (directly through the "Parameters" windows that
will pop-up or via the "View" dialog).
If
you changed your data and ask directly for a chart, the new data will
not be taken into account. On the contrary, if you have already ran the
calculations earlier and have not changed your data but want simply
display another parameter, at this sole condition you can directly
output the result.
Calculations
made by VOACAP can be displayed either in tabular form (line printer style
reports) or, easier to read, in graphical form showing iso-contours of parameters
on a Frequency vs. Time plot.
To
launch the calculations you need to click on the main "Run"
dialog and select either "Circuit" or "Chart"
whether you want later to print a tabular line printer text report or display
a chart.
Among
the other output options name the Batch, Distance and Time plots that are much
less used but that show some interesting curves too.
Run
"Chart"
In
selecting "Chart" in the "Run" dialog, VOACAP
performs propagation calculations and creates an output graphic file named
"voacapg.out" that is displayed in chart form (see below
"Parameters" windows).
Run
"Circuit"
You
can also select "Circuit" in the "Run" dialog. VOACAP
performs then the same propagation calculations that previously but it displays
no data in chart forms. It only creates an output file named
"modelx.dat" (e.g. voacapx.dat) and then executes the propagation module
..\BIN_WIN\modelw.exe. The results is saved in the file "modelx.out" and then
displayed on screen...
Note
that Methods 11 or 28, as listed in the parameters, produce outputs that will be displayed graphically, rather than
in a report.
"Parameters"
window
When
the calculations are completed (usually that last between a few
seconds and 20 seconds or so), the "parameter" window will
pops-up. Depending on the model this window will display a more or
less extended list of functions that you can select and display in a chart form.
Not
all parameters are easy to understand without good knowledges but you can learn
much things on propagation if you study seriously these parameters when working
on the air or just after.
The
most useful are the signal-to-noise ratio at the required reliability (SNRxx)
and power signal lower decile, both expressed in dB. These parameters can bring to the fore slight
variations in the signal strength in the course of the day that you can benefit
to plan your activities (an increasing favorable to DXing or on the contrary a
decreasing, sign of QSB and bad propagation).
Click
on a parameter to display the concerned chart. Each chart provides a menu
allowing you to copy the graph in the clipboard, to print it in color or B/W, to
select a new parameter to display, to add custom curves (e.g. MUF, LUF, FOT,
etc) or to change the scale from 2-30 MHz for example to 2-10 MHz.
Recall
that if you have already ran the calculation you can simply click on the
"View" dialog and select "Chart" to get the
"Parameters" window. This window pops-up also in charts under the menu
"Parameters".
Reliability
and accuracy of VOACAP forecasts
To
get a good prediction, logical, valid and thus "good" because
reliable, you must not only set all input parameters correctly, but also select
the output parameters that match your inputs. Indeed, some parameters depend on
system parameters other are independent of these conditions.
Without
set the antenna properties included in the system group for example, you can get
an accurate prediction about the MUF and several methods permit to predict its
frequency. The MUF and other FOT depend only on the circuit (at 3000 km from the transmitter),
month, time of day, and SSN. Its frequency is not affected by the antenna design
or the transmitter power for example.
Conversely
output parameters like SNR, REL, DBU, RPWRG, SIGL, SNRLW are dependent on the
system parameters, the signal-to-noise for example being closely related to
antenna properties and the level of noise and QRM. To get a valid prediction you
must set parameters of this group, as well as Tx and Rx Antenna. To achieve this
you need to know the radiation pattern and the other properties of your antenna.
In this purpose VOACAP provides a small application called HFANT (see below).
Among
the many output parameters (SNR, LOSS, SDBW, SNRLW, SNRxx, etc), VOACAP provides
REL. for reliability. Recall that his is the percent of time that SNR
exceeds the “Required Reliability”, SNRxx. As we explained previously, the
default required reliability is usually set to 90%, the industry standard,
providing an excellent signal quality (comfortable audio, low QRN, etc). Reliability
is defined as the fraction of days that successful communication may
be expected at a given hour within the month in the specified conditions. Like any
global forecast using median values, we must specify that reliability is the expected
performance on the undisturbed days of the month, nominal conditions, and
thus do not accurate forecast the effect of short-term ionospheric anomalies
that are ignored in this model.
VOACAP,
like ICEPAC or REC533 are really monthly median models, hence the use of
statistical functions and reliability parameter. These models were never designed to predict
current ionospheric conditions, near-real-time forecast or even a
day-of-the-month prediction because they use anything other than
smoothed sunspot numbers which accuracy increases with time considered,
the longer the best.
VOACAP
can handle the short-term ionospheric fluctuations but only by applying
statistical factors that are based on measured SNR distributions over
the month when we run the higher reliabilities. Thus, do not expected
the same accuracy and the same features as a product working with
real-time sounding.
 |
 |
|
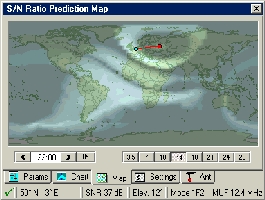
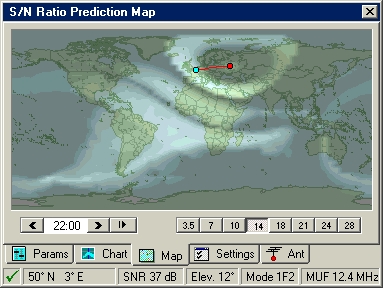
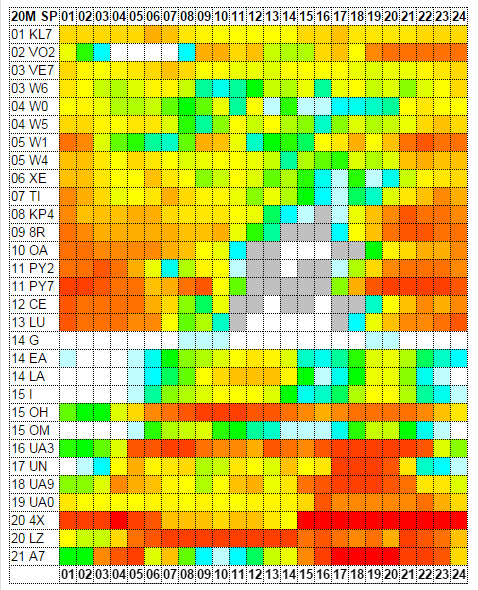
VOACAP
prediction compared to the one of Ham
CAP, that uses also this model but with less
parameters, giving thus an overview of propagation.
This is a forecast calculated for a circuit between
Moscow (UA3) and Belgium on August 5, 2004 at 2200 UTC
on 20 meters and 100 W output (SSN = 27, SFI = 85), a
minimum takeoff angle of 3° and a rural QRM in ON.
VOACAP predicts a signal strength in Belgium of -140
dBW or S3 and a S/N ratio of 27 dB, thus weak. The MUF
over Belgium for a 3000 km path is predicted at 11.9
MHz but DXAtlas is more acurate and predicts a MUF
at 17.9
MHz. At right, Ham CAP predicts a MUF at 12.2 MHz
over Belgium with a stronger SNR of 37 dB. In the
field UA3 stations were indeed weak (S3-S4) but could
be worked on 20 meters in SSB with few noise
contrarily to what stated non-VOACAP
based applications, most predicting a MUF close to 9
MHz and no reception possible across Europe. In this
context, the VOACAP model shows all its utility,
giving predictions much more accurate that any
non-VOAVAP based application. |
|
George
Lane who devised IONCAP and wrote its manual get very concerned
when amateurs use these models for very short-term predictions. We must
repeat it : neither IONCAP, VOACAP or one of the additional module
listed below has never been validated for that purpose. All the less when we know that
these models ignore geomagnetic field indices and don't use real-time
ionosonde data (but rather median values and predefined tables).
Short-term forecasts have thus a limited accuracy, many disturbances are
not taken into account, but these predictions are in spite of everything
very useful if we know their limitations.
For
example, VOACAP doesn't forecast the auroral activity because it is
not designed for automatic modeling of such an phenomenon. Unfortunately,
when amateurs point their antenna at high latitudes
in presence of northern lights they experience enhanced propagation to other
locations. Indeed, the auroral oval acts like a reflective wall and bends sky
waves along paths that are off-azimuth over very long distances.
In these occasions the MUF is well above 30 MHz. Up to now VOACAP is
unable to forecast these events and we must rely on other applications.
In
the same way, many listeners use VOACAP to predict propagation conditions in the
top band of 1.8 MHz or LW bands. Unfortunately VOACAP is ray hop model for
ordinary HF sky wave propagation and has no mean to take into account
propagation through the residual E-layer acting like "wave guide" when
dark paths are involved in the medium wave band. According to George Lane, the
only way to get a more or less realistic prediction is to run the Wang's LW
model together with VOACAP and to select the prediction showing the highest
signal power.
Additional
modules
Several
additional modules are provided with VOACAP. All are independent but
are interfaced with VOACAP when you call some functions to take for
example into account your antenna properties (HFANT), the receive area (VOAAREA)
or interferences (S_I_VOACAP).
ICEPAC
ICEPAC
stands for Ionospheric Communications Enhanced Profile Analysis & Circuit
Prediction program. It is as powerful if not more as VOACAP. It
is a statistical model of the large-scale features of the northern hemisphere. It
uses also an improved IONCAP model but includes in addition the ICED (ionospheric
conductivity and electron density) model. It provides thus some
additional displays not included in VOACAP. ICEPAC recognizes the different physical
processes that exist in the different regions of the north hemisphere ionosphere and
contains distinct algorithms for the sub-auroral trough, auroral zone, and polar cap.
 |
 |
|
A
propagation prediction calculated for a path between ON and ZD9
(Tristan da Cunha) at 9906 km away during the solar maximum using
Method 20, reliable. At left calculated by VOACAP, at right by
ICEPAC. These graphs show the typical difference between both
programs : ICEPAC is more conservative, predicting a signal in a
range between 1-4 dB or half an S-point less strong during an
interval time of half an hour against VOACAP; not much more than a
hiss. To compare with the prediction displayed below using Method
30. |
|
However,
ICEPAC was no as extensively validated as VOACAP and unlike
this latter, it doesn't take into account a smoothing function between short and
long paths (ray hop vs. forward-scatter regions) for all distances between 7 and 10,000 km.
Once your reach these distances there is abrupt transition
between short and long paths. Therefore, in some circumstances,
if you calculate for example a prediciton between Belgium and Tristan da Cunha
(ZD9) as below, the ray hop model finds an ionospheric
control point with a discontinuity of nearly
10 dB at mid-path, causing artificial SNR losses exceeding 23 dB,
whereas the long path model used by VOACAP finds a weak but detectable signal
which is actually there, assuming a scatter propagation mechanism. This is for
this reason that in ICEPAC it is well stated beside the Method 30 "For
VOACAP only - S/L path smoothing (7-10000 km)".
 |
 |
|
Same
prediction as above, calculated for a path between ON and ZD9
(Tristan da Cunha) at 9906 km away during the solar maximum but
using Method 30 this time, not reliable at that distance. At left
calculated by VOACAP, at right by ICEPAC. These graphs show the
typical difference between both programs. Both give a similar signal
strength at 22h on 14 MHz, about -138 dBW within 1 dB. But ICEPAC is
in error when predicting a signal of -168 dBW at 14h on 28.5 MHz.
According to VOACAP the signal is 23 dB stronger, -145 dBW ! A little
bit more than a hiss this time, about 4 S-points and thus enough to
work ZD9... |
|
On
another side, ICEPAC provides some additional iso-contours maps not available in
VOACAP like the SRNxx (Method 20). Results are more accurate
and the graph also more complete, but you must well known limitations of this
program.
REC533
Its
name comes after the ITU-R Recommendation P.533-6. This is a derived version
of VOACAP offering some additional functions dedicated to S/N estimations, distance and time.
HFANT
HFANT is
an add-on to VOACAP and shares its data with it as soon as your antenna
properties must be taken into account to calculate a circuit. When launched in stand-alone
this graphic tool is able to display the radiation pattern of antennas in both azimuthal and
elevation planes.
 |
 |
|
In
addition to propagation forecasts, the VOACAP
package provides free HFANT that permits to
simulate the radiation patterns of antennas. Above
left the settings for a 3-element Yagi placed 10m
high and cut for the 20m band. A right the
azimuthal radiation pattern of this antenna
|
|
All
sample files can be modified to suit your need as display above,
showing the settings and radiation pattern calculated for a custom
3-element Yagi placed 10m high and working on the 20m band. This
module will be very useful to all amateurs wishing to buy EZNEC but
who cannot pay for it. This version shows an accuracy very close or
even identical to this latter (or any other NEC-based modeling program) and it is
free !
Here
is for example a screen dump
showing the largest variations between HFANT (ItsHF) and NEC models when
computing the radiation pattern of a 3-element Yagi. But these differences are
mainly due to the fact that the HFANT Yagi used "thin" wires while the
NEC Yagi used 0.5" diameter tubing. When both models used the same
specifications, graphs are similar over 99%, as diplayed in this second screen
dump showing the radiation pattern of a 1/2l-long
dipole cut for the 20m band and tight 15 meters high (50 ft).
So,
avoid to enter any one data in VOACAP (System and Tx Antenna groups) without
have first simulated your antenna in HFANT. In doing the contrary you have all
chances to predict anything as you have not taken into account your real antenna
properties.
VOAAREA
VOAAREA is
dedicated to point-to-area coverage analysis. It was mainly developed for
broadcast purposes but can be used for amateurs activities as well. The forecast
is centered on the receiver location and displays in addition the size of
the plot area. This is a very interesting module that displays most output parameters
of the VOACAP model (e.g. SNR, SNRxx, SDBW, etc). It permits to better understand coverage
problems at long distance according the radiation pattern of your antenna and to
see how strong can fluctuate your signal around the receiver location (e.g. over 10 dB
over a distance of about two thousand kilometers).
 |
 |
|
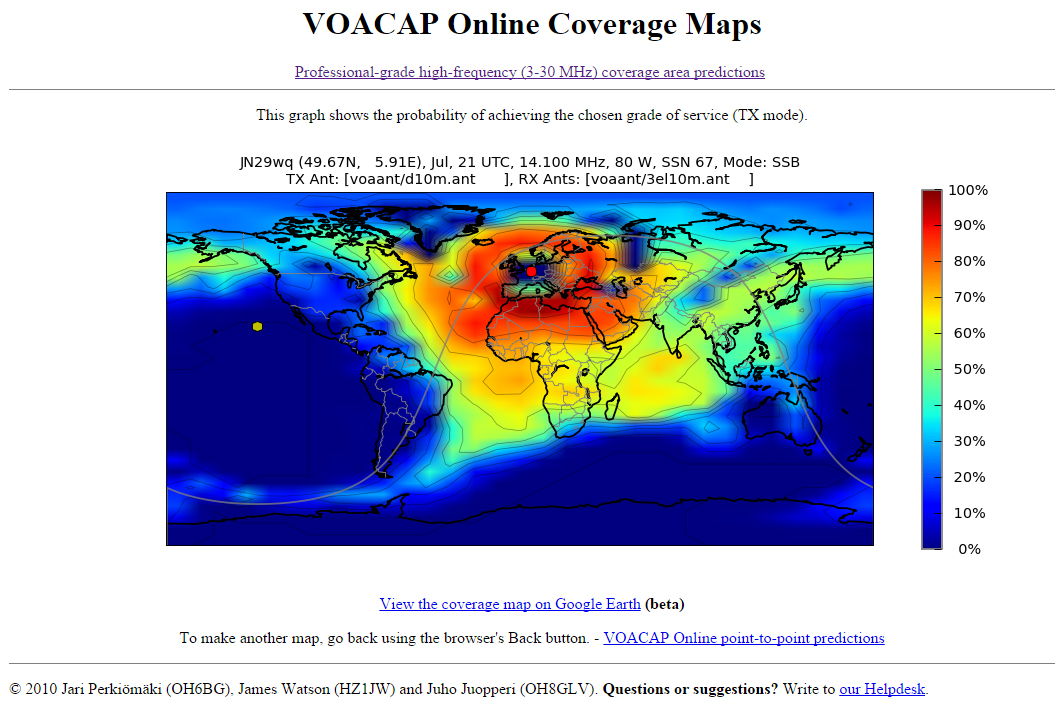
At
left a Point-to-Area map
created with VOAAREA for a transmission made from ON on August 2004
on 20 meter taking into account the propagation conditions
and a SSN of 85, an SNR of 50 dB and an SNR req.reliability of
50%. The power was set to 100 W using a G5RV dipole tight in
east-west direction. The grid selected (for the map) was "1 =
Lat/Lon" and set to -50/+65° of longitude and 0°/90° of
latitude. To get results similar to the ones of MultiProp (right)
I used the CCIR coefficients and I didn't use the "day-of-the-month"
either (e.g. 8.15) to avoid VOAAREA to switch to
URSI coefficients. The layer CIRAF zones was removed for more clarity and
the grid size was set to a "low" resolution (61x61), eleven
times lower than the maximum (361x361) available in this
application. At right the same simulation
calculated with MultiProp
that uses MultiNEC with VOACAP. The grid size was set to the
highest value, 61x61 in this case. Even at lower resolution (30x30)
VOAAREA results are a bit more accurate than ones of MultiProp.
Note that both map projections are different, as well as contour levels.
These maps match what
I experimented in the field. Recall that a signal power of -120 dBW ~ S5. |
|
The
menu differs slightly from VOACAP. To get a result you have first to setup
correctly your circuit parameters like in VOACAP. In addition for more clarity
remove for example CIRAF zones ("Layers" group, select
"ignore" for the field "CIRAF zones"), select the grid to
display ("Grid" group and select "21 = NE hemisphere"
or "1 = Lat/Lon" and enter in the "Plot" group the maximum
width of the map, e.g. -70/+70, 0/+90) and at last select the grid size (default
is 31x31) knowing that over 200x200 calculations exceed 1 minute on
a 500 MHz computer.
When
all parameters are set, on the menu, select "Run", "Calculate
>" then "Save/Calculate/Screen" to start the calculation, save
the output (*.vg1) and display immediately the map. If you want to display the
map later, select "Calculate >", then "Save/Calculate" to
start the calculation and save the result in the *.vg1 output file. Later select
"Run", "Plot result", "File" and open the file
previously saved. Then select "Plot to" and "Window". You
will get a map similar to one display above left or at another resolution.
S_I
VOACAP and S_I ICEPAC
These
two models are especially designed to predict the signal-to-interference ratio. Inputs are two transmitters and one receiver
station, and you have the possibility to change parameters like the receiver
bandwidth, required S/I protection ratio, S/I probability. or to set SNRxx
minimum value below which the S/I calculations are skipped. The program calculates then interference
parameters and displays its results using the same graphs as VOACAP or ICEPAC.
Support
If
you experiment any problem using the VOACAP package, do first check the readme
files provided with the product. Then send all required information by email to Rob
DeBolt or Paul McKenna at NTIA/ITS who maintains the three main applications VOACAP, ICEPAC
and REC533.
However,
as explained below, the new VOACAP online replaces advantageously the original
version.
My
final impression
(before 2010)
VOACAP
counts without any doubt among the few seldom powerful and flexible analysis and prediction
program available. VOACAP is the most accurate HF
prediction tool due to the extensive adjustments made during it's creation,
as predictions were compared with a great body of worldwide Voice of America
listener reports. Also, time passing, there were some additions to improve its
accuracy - like the smoothing function of Mode 30 - that do not appear
elsewhere. As a result, VOACAP is rightfully considered as the "gold
standard" of propagation programs. With time it shows however some ripples.
As it,
the graphic user interface of VOACAP is outmoded. It is not too bad but not really
user-friendly either, essentially when you need to display an output parameter
or modify a chart. Hopefully, since its release other programs have filled this gap and have
provided a better user interface (e.g. MultiProp, ACE-HF Pro, PropMan-2000, Ham
CAP, DXAtlas, WinCAP Wizard, etc).
Released
in 1997 on a design written in Fortran 13 years earlier, VOACAP
is aging. Some years ago I wrote here : "It should be welcome to design a complete new product taking
advantage of new programming languages and algorithms, a down-sized version of the IRI
(signal and noise models) and IGRF (geomagnetic) models and why not, cherry on the cake,
real-time ionosonde data to improve its accuracy". We will see that if this time
is not arrived yet, some improvements have been done !
Let's
take some examples of non-fulfilment of of the original product. As we noted, VOACAP does not use geomagnetic indices.
Even some major competitors consider them (Ap and Kp) as "useless". But they are wrong
because either they have not seriously learnt propagation fundamentals or they
never worked in conditions in which the Kp index enters into play.
All
geophysicists might tell that the p-index is however useful to calculate
many geomagnetic effects. If Kp index doesn't improve the accuracy of short-term
forecasts, it highlights disturbed conditions like a noise makes us prick the
ears and the dependency between the geomagnetic activity and the depletion of
the F2 layer. Then Kp index helps estimating the geomagnetic influence on propagation
at high latitude during auroral events. It also permits to predict propagation on the top band where
magneto-ionic effects become important (as are the sunset/sunrise and weather
conditions, two parameters ignored by most programs as well).
At last, Kp index
permits to check antenna performances according to their
polarization (we know that at low latitudes, vertical antennas for example don't
couple properly with the horizontal component of the magnetic field, etc). Of
course, everybody uses VOACAP for short-term predictions too, but we know
its limitations and what mean probabilities, or we should.
VOACAP
Online
We can say that
since 2010 a fresh wind full of good feelings has blown on VOACAP, almost
a revolution !
Indeed,
since 2010 Jari Perkiömäki (OH6BG/OG6G), James Watson (HZ1JW) and Juho Juopperi (OH8GLV)
have taken the responsibility to improve the VOACAP interface. They have included several
very awaited modules among them the most interesting is the online interface, VOACAP.com,
that allows all Internet users to get a point-to-point prediction for free
without having to enter all data manually. This interface is available for the
three main platforms : Windows, Linux, and Max OS X.
The
User Guide is available.
In 2012, Jari added the Coverage Area Map,
then a Planner very appreciated by
contesters. In 2015, the DX Chart
was added for DXers. In addition a VOACAP blog
is opened since 2012 where users can exchange ideas with developers and keep informed of the new releases and
enhancements.
Also
note that since that time VOACAP is included in the new DX
Summit cluster (when you select a call sign, also select "Show VOACAP
Predictions") to get a point-to-point prediction for your QTH.
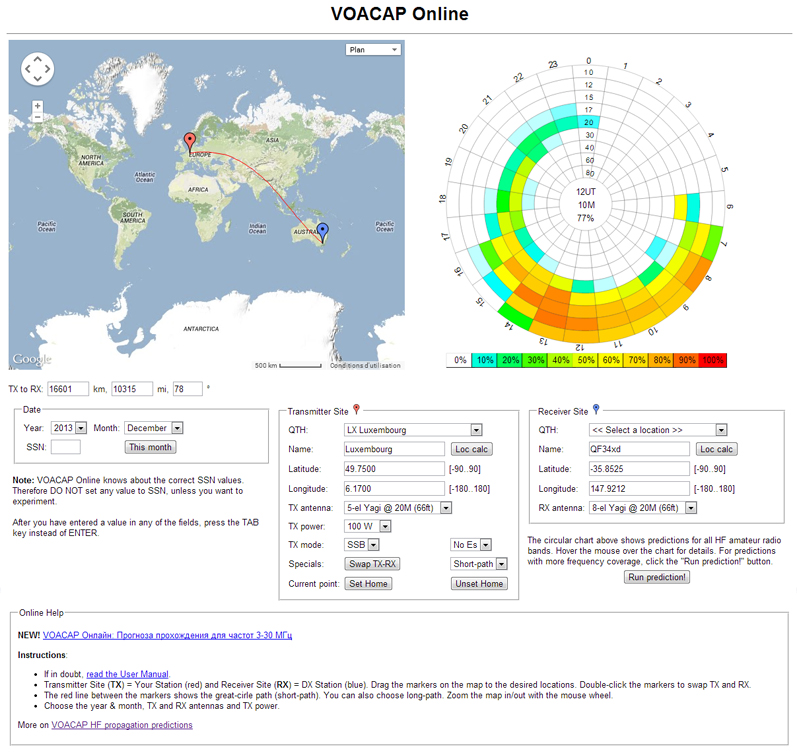
Below
are some screenshots of the new VOACAP online. The evolution is not only obvious
but the ease of use is without comparison with the old interface. This time,
even the youngest radio operator can use it and get a prediction in a few
seconds !
However
the IRI model as well as geomagnetic indexes (Ap and Kp) are always excluded
from the interface (the VOACAP engine remaining the "classic" one) while SSN can be entered manually
as in the original version (you can get the data set in subscribing to IPS
maillist, see this article).
If
the new online version does not reflect the propagation conditions in
real-time, using accurate data and specially an accurate SSN when the sun
activity is very high, VOACAP can calculate reliable preditions, even if they
remain averaged and statistical data.
In
all cases, with all these new options VOACAP online is became a must for all fans of
propagation. Congrats to Jari and his team for all their efforts !
Other good news, some amateur products are till more accurate in some specific
modules, to name DXAtlas designed by Alex Shovkoplyas,
VE3NEA, that is integrated with HamCAP (that uses the VOACAP engine), IonoProbe
and Band Master, and includes quasi real-time ionospheric maps.
The
other "competitors", those who do not use the VOACAP engine, should follow this idea if they want
to sell other thing that low-end and useless products in the future.
To
be frank, today a radio amateur should only use the VOACAP online interface (and gave up ICEPAC)
each time that he needs of an accurate forecast. However he will probably have to
rely on other products when for example he look for the signal strength
of beacons or to get online the latest solar, geomagnetic and spaceweather data
or alert bulletins.
Indeed,
no products could provide all these features. Currently amateurs need at least
of two or three applications, including web-based, to get a complete overview of propagation conditions.
Bottom
line, if you don't want to invest some money in a prediction program and have an Internet
connection, go with VOACAP online (without connection use e.g. HamCAP); it is free,
fully supported, and with all its modules, not only it is more complete than its
embellished competitors but it is also more accurate than all no-VOACAP based programs.
A good alternative that seems more accurate is Proppy.
Whatever
the version you use, have good DX !
For
more information
What
can we expect from a HF propagation model ? (on this web)
SSN
or the short history of the Smoothed Sunspot Number (on this site)
Proppy
(an alternate to VOACAP using the new ITURHFProp model)
For
more information about VOACAP, read L.R.Teters, J.L. Lloyd, G.W. Haydon and
D.L. Lucas, "Estimating the Performance of Telecommunication Systems Using
the Ionospheric Transmission Channel" (5.4 MB PDF file), Institute for Telecommunication
Sciences, NTIA Report 83-127, July 1983.
VOACAP
engine to download from Greg Hand's website
VOACAP
Online (the online version), OH6BG, including all modules, a guide and a list of
common mistakes made by users
VOACAP
Mailing List (to be informed about all functionalities of the product)
NTIA/ITS
(the developer's website)
User's
Guide (book), by George Lane/Rockwell Collins
ICEPAC
technical and user's manuals, by NTIA/ITS
Broadcast
analysis and prediction in the HF band, IEEE Xplore
Some
VOACAP-based programs:
VOAProp,
by G4ILO (replacing HPProp)
ACE-HF
Pro, by ACE-HF
HamCAP
and DXAtlas, by VE3NEA
MultiProp,
by AC6LA
PropMan-2000,
by Rockwell Collins
WinCAP Wizard,
by Jim Tabord Software (closed down).
Back
to Menu |


