Epoch 2005 July 9.0 TT = JDT 2453560.5
T 2005 July 5.3153 TT                                   MPCN
q   1.506167             (2000.0)            P               Q
n   0.1787117      Peri.  178.8390      -0.3779058      +0.9100015
a   3.121530       Node    68.9373      -0.8509115      -0.2687824
e   0.517491       Incl.   10.5301      -0.3648792      -0.3156792
P   5.52
From 672 observations 1967-2000, mean residual 0".8.  Nongravitational
     parameters A1 = +0.01, A2 = +0.0018.
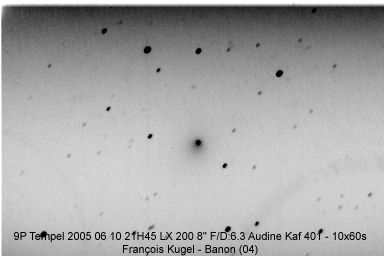
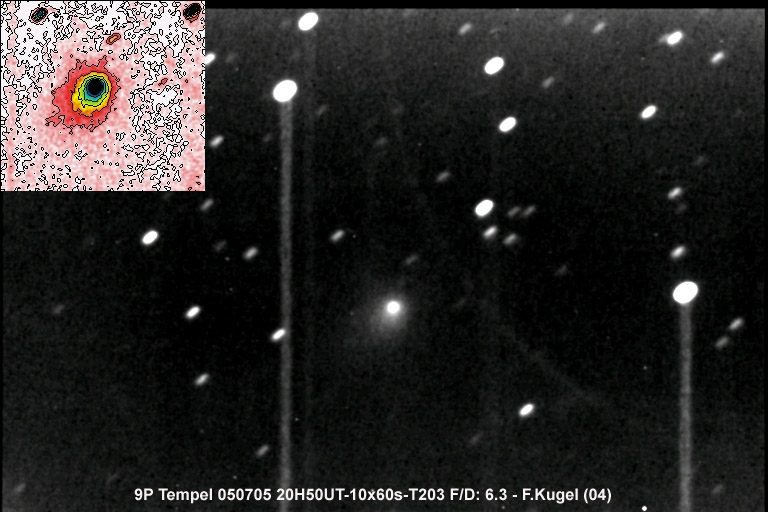
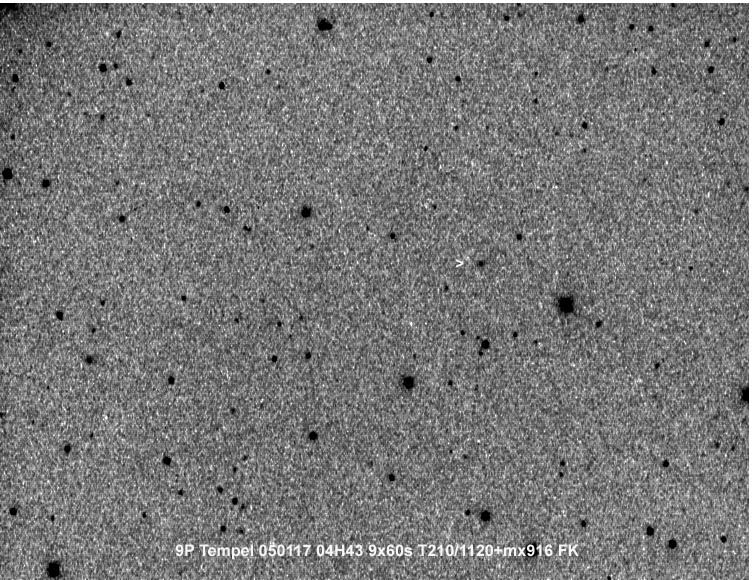
Deep impact :
Afrho

This plot shows the brightness of the dust coma, in terms of the Afrho
parameter, with time. Professional measurements (diamonds) from the 1983,
1994, and 1999 apparitions and STSP measurements (crosses) from the 1999
and 2005 apparitions are plotted with respect to days from perihelion
(Lisse et al., 2005, McLaughlin et al., 2003, and private communications
with STSP participants, 2004-2005). The Afrho parameter (A'Hearn et al.,
1984) is useful for long-term studies of the behavior of the dust coma
because it removes variations introduced by changing heliocentric
distances, geocentric distances, and aperture sizes. An Afrho measurement
of 100 centimeters equates to about 100 kilograms of dust per second.
A'Hearn, M. F., D. G. Schleicher, P. D. Feldman, R. L. Millis, and
D. T. Thompson, 1984. "Comet Bowell 1980b", Astronomical Journal, 89,
579-591.
Lisse, C.M., M.F. A'Hearn, T.L. Farnham, O. Groussin,
K.J. Meech, U. Fink, and D.G. Schleicher, The Coma of Comet 9P/Tempel 1,
Space Science Reviews (2005, in press).
McLaughlin, S.A., L.A.
McFadden, and G. Emerson, 2003, Science with Very Small Telescopes
(<2.4 meters): The NASA Deep Impact Mission's Small Telescope Science
Program in The Future of Small Telescopes in the New Millenium, Volume III
- Science in the Shadows of Giants, Ed. Terry D. Oswalt, Astrophysics and
Space Science Library, Kluwer Academic Publishers, Volume 289, p. 57.
Afrho Plots for Tempel 1 and other comets
 STSP Coordinator: Stef McLaughlin
Webmaster: Elizabeth Warner
2011
Epoch 2010 Dec. 30.0 TT = JDT 2455560.5
T 2011 Jan. 12.3656 TT                                  MPC
q   1.510301             (2000.0)            P               Q
n   0.1785067      Peri.  178.9231      -0.3770555      +0.9103837
a   3.123919       Node    68.9072      -0.8511227      -0.2680317
e   0.516537       Incl.   10.5224      -0.3652661      -0.3152149
P   5.52
From 4793 observations 1967-2006, mean residual 0".6.  Nongravitational