A spectroscope can be used to measure the real transmission of a given filter. As one of my project was to perform photometry from my acquired spectra, I needed synthetic filters curves. Some can be found on the web but I wanted my synthetic curves to match the response of the glass filters I have. Usually, such a work is done in laboratory with a stable light source. But I don't have any at hand so I decided to use one free light source, that of the stars themselves. Of course, it would also have been possible to send the filters to someone that can do that job. But by the way, this was also a good exercise in my learning curve of spectroscopy.
To
measure the response of a filter from a star, it is best to choose one
that have the smoothest continuum spectrum possible, with the fewest
absorption bands. The stars that correspond to this description are
blue, from late O to early B type, if possible already at a giant phase
(class IV to III), since the lower internal pressure of the star leads
to less pronounced absorption bands.
When I began that work in December 2018, one interesting star was easily accessible from my site early in the evening: Algenib, Gamma Pegasi, a sub-giant hot blue star (B2IV). Here is the complete spectrum of the star that I have obtained, showing the nice, almost perfect light continuum:
Measuring the response of a filter is simple : you just have to divide one spectrum of the star obtained with the filter, by the spectrum of the same star without the filter. All spectra should be calibrated in wavelengths of course, but no other operation is required than that simple division. Here is a montage of the spectra obtained for my photometric UV, B, and V filters (from Baader):

Trying
to measure filters of longer wavelengths poses a problem: with the Star
Analyser, the blue end (left) of the second order spectrum begins inside
the infrared (right) end of the first order spectrum, from 750
nanometers (or 7500 Angströms). As a result, making a direct division of
a red filter spectrum by the whole star spectrum would lead to errors,
since the red filter is not going to transmit the blue/red overlap. To
solve this problem, the primary spectrum has been obtained through
long-pass filters. For the Johnson red filter I used Baader longpass
yellow (495 nm cut-on), and for infrared filter I chose Baader red
longpass filter (610 nm cuton).

| Here are the raw spectrum of Algenib without filter (in red) and the raw spectrum of Algenib with the Johnson B filter (in blue) |  |
|
 |
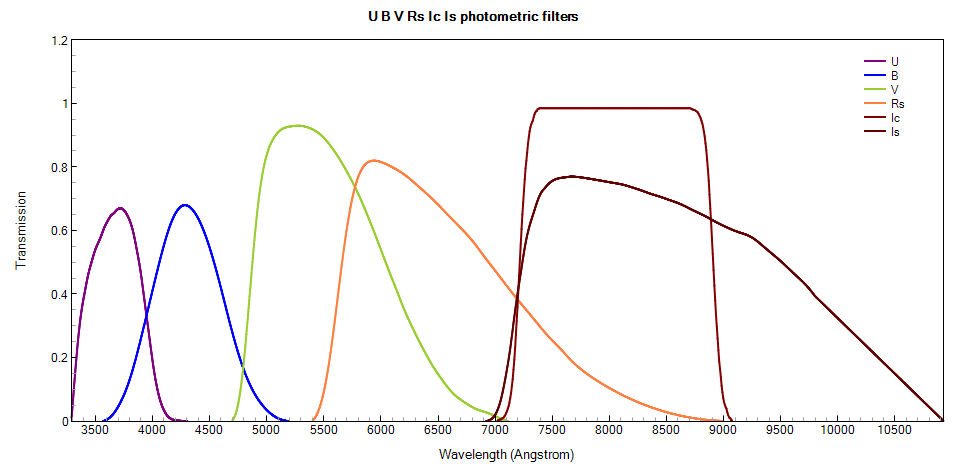
The
absolute intensity of a filter's response can be calculated departing
from the exposure times of each spectrum but this was not important for
my project. I have opened the files in a spreadsheet and modified all
values so that the highest intensity match the theoretical maximum value
of the filters. I only had one strong problem: the photometric IR filter
I have, from an old Schüler Astro-imaging BVRsIs set, was very hard to
measure because the transmission of the filter goes far into the
infrared, and the end of the spectra proved to be always too much noisy
to obtain a valuable profile. Moreover, the current filter's response
that is commonly used today is not the same - it is the Johnson-Cousin
Ic filter. I have no Ic glass filter on my equipment, but I have built a
synthetic curve directly from a spreadsheet.
Here
are the synthetic filters I'm using (Is filter is shown only for
information, it will not be used for spectro-photometry):