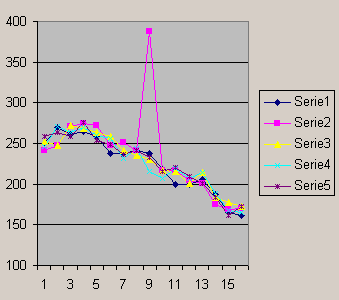
Techniques of calculation
We suppose to have N=5 samples, corresponding to the same pixel on 5 registered images of the same astronomical field:x1, x2, x3, x4, x5;then we shall see how to estimate the corresponding element y of the resulting image by means of the application of three different techniques.
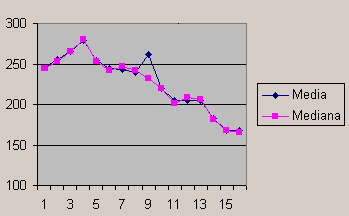
Median sum
-
the samples are listed in increasing order:
y1 £ y2 £ y3 £ y4 £ y5 ; - if N is odd, the median element corresponds to the central element of the list, that is the one that occupies the position med=(N+1)/2 in the ordered list (in this example N=5 and med=(5+1)/2=3; therefore the median is y = ymed = y3);
- if N is even, then the median represents the average of the two central elements of the list, that is those that occupies the positions N/2 and (N/2+1).
Arithmetical sum
-
The result is represented by the sum of the samples: y
= x1 + x2 + x3 + x4 + x5 .
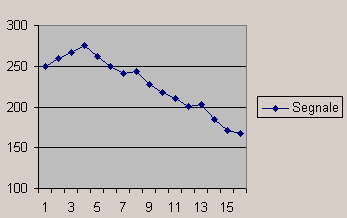
Arithmetic mean
-
The samples are added and the result is divided for their number N:
y = (x1 + x2 + x3 + x4 + x5) / 5 .
Modalità di calcolo
Supponiamo di disporre di N=5 campioni, corrispondenti allo stesso pixel su 5 immagini, messe a registro, dello stesso campo:x1, x2, x3, x4, x5;vediamo come si calcola, mediante l'applicazione delle diverse tecniche, l'elemento corrispondente y.
Somma mediana
-
si ordinano in senso, p. es., crescente:
y1 £ y2 £ y3 £ y4 £ y5 ; -
se N è dispari l'elemento mediano corrisponde a quello centrale,
ovvero quello che occupa la posizione med=(N+1)/2 nella lista ordinata
(nel caso in questione N=5 e med=(5+1)/2=3; perciò l'elemento mediano
è
y = ymed = y3 ); - se N è pari, allora si prende come mediano la media dei due elementi centrali della lista, ovvero quelli che occupano le posizioni N/2 e (N/2+1).
Somma aritmetica
-
Il risultato è rappresentato dalla somma dei campioni:
y = x1 + x2 + x3 + x4 + x5 .
Inoltre il risultato è sensibile alla presenza di picchi spuri che si discostano sensibilmente dalla media dei valori.
Media aritmetica
-
I campioni vengono sommati ed il risultato viene diviso per il loro numero
N:
y = (x1 + x2 + x3 + x4 + x5) / 5 .