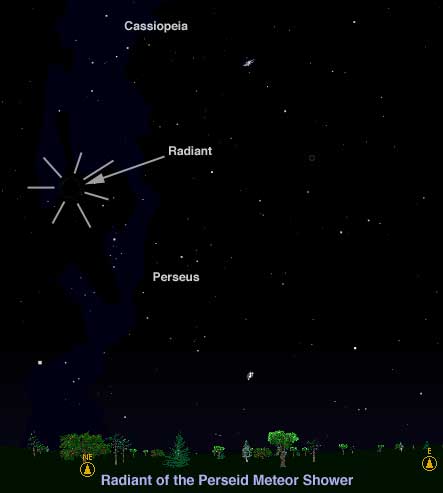
(Image produced by the Author using Starry Night 2.0 and Adobe Photoshop 5.0. It represents the view from mid-northern latitudes at about midnight local time around August 12.)
Perseids
Best Night: August 11/12, with about 80
meteors per hour
Total Duration of Activity: July 23 to August 22
The point from where the Perseid meteors appear to radiate is located within the constellation Perseus and is referred to as the radiant. The location of the radiant in astronomical terms is RA=47 degrees (3 hours 8 minutes), DEC=+57 degrees, but the chart below will also help you find it.
(Image produced by the Author using Starry Night 2.0 and Adobe
Photoshop 5.0. It represents the view from mid-northern latitudes
at about midnight local time
around August 12.)
To best observe the Perseids
wear appropriate clothing for the weather. Lie outside in a
reclining lawn chair with your feet pointing southward and look
straight up. Do not look directly at the radiant, because meteors
directly in front of you will not move much and fainter ones
might be missed. Decent numbers of Perseids can be seen beginning
around 10 p.m. local time,
but the best show picks up after midnight and continues until
dawn. When you see a meteor mentally trace it backwards and if
you arrive at Perseus it is probably a Perseid.
This is the most famous of all
meteor showers. It never fails to provide an impressive display
and, due to its summertime appearance, it tends to provide the
majority of meteors seen by non-astronomy enthusiasts.
The earliest record of its
activity appears in the Chinese annals, where it is said that in
36 AD "more than 100 meteors flew thither in the
morning." Numerous references appear in Chinese, Japanese
and Korean records throughout the 8th, 9th, 10th and 11th
centuries, but only sporadic references are found between the
12th and 19th centuries, inclusive. Nevertheless, August has long
had a reputation for an abundance of meteors. The Perseids have
been referred to as the "tears of St. Lawrence", since
meteors seemed to be in abundance during the festival of that
saint on August 10th, but credit for the discovery of the
shower's annual appearance is given to Quételet (Brussels), who,
in 1835, reported that there was a shower occurring in August
that emanated from the constellation Perseus.
The first observer to provide an
hourly count for this shower was Eduard Heis (Münster), who
found a maximum rate of 160 meteors per hour in 1839.
Observations by Heis and other observers around the world
continued almost annually thereafter, with maximum rates
typically falling between 37 and 88 per hour through 1858.
Interestingly, the rates jumped to between 78 and 102 in 1861,
according to estimates by four different observers, and, in 1863,
three observers reported rates of 109 to 215 per hour. Although
rates were still somewhat high in 1864, generally
"normal" rates persisted throughout the remainder of
the 19th-century.
Computations of the orbit of the
Perseids between 1864 and 1866 by Giovanni Virginio Schiaparelli
(1835-1910) revealed a very strong resemblance to periodic comet
Swift-Tuttle (1862 III). This was the first time a meteor shower
had been positively identified with a comet and it seems safe to
speculate that the high Perseid rates of 1861-1863 were directly
due to the appearance of Swift-Tuttle, which has a period of
about 120 years. Multiple returns of the comet would be
responsible for the distribution of the meteors throughout the
orbit, but meteors should be denser in the region closest to the
comet, so that meteor activity should increase when the comet is
near perihelion (as has been demonstrated by the June Boötids,
Draconids and Leonids).
As the 20th-century began, the
maximum annual hourly rates of the Perseids seemed to be
declining. Although rates were above Denning's derived average
rate of 50 per hour during five years between 1901 and 1910, the
observed rate in 1911 was only 4 and for 1912 it was 12. Denning
wondered whether the shower was declining, but hourly rates
seemed to return to "normal" in the years that
followed. Quite unexpectedly the shower suddenly exploded in
1920, when rates were estimated to be as high as 200 per hour.
This was extremely unusual as it came at a time when the parent
comet was nearing aphelion! Although a few weaker-than-normal
years occurred during the 1920's, the Perseids regained their
consistency thereafter, and, except for abnormally high rates of
160 and 189 during 1931 and 1945, respectively, nothing unusual
was observed up through 1960.
During 1973, Brian G. Marsden
predicted Comet Swift-Tuttle would arrive at perihelion on
September 16.9, 1981 (+/-1.0 years). This immediately generated
excitement among meteor observers as the potential for enhanced
activity unfolded. This excitement seems to have been fully
justified, as the average rate of 65 per hour during 1966-1975
suddenly jumped to over 90 per hour during 1976-1983---with the
high being 187 in the latter year. Although meteor observers
seemed content with their observations of the enhanced activity
from Swift-Tuttle, comet observers were less enthusiastic as the
comet was never recovered.
Since the 1983 peak, hourly rates
for the Perseids declined. With a full moon occurring just a day
before maximum in 1984, the Dutch Meteor Society still reported
unexpectedly high rates of 60 meteors per hour. In 1985, reported
rates generally fell between 40 and 60 meteors per hour in dark
skies, and results were generally the same in 1986.
As the 1990s dawned, Marsden
published a new prediction. If P/Swift-Tuttle was actually the
same comet seen by Kegler in 1737, then the comet might pass
perihelion during December 1992. The comet was recovered late in
the summer of 1992. Although not one of the most spectacular
apparitions, the comet was well observed. But meteor observers
were waiting for the Perseid display of 1993. Predictions
indicated Europe was the place to be during the Perseid maximum
of 1993. Observers from around the world flocked into central
Europe and were met with hourly rates of 200 to 500. High rates
were still present during 1994, this time with the peak occurring
over the United States.
From the 1860s onward, studies of
the Perseids began to include more than just hourly rates.
Numerous observers began to plot the paths of meteors onto star
charts to derive the points from which the meteors seemed to be
radiating. The most prolific observer of this stream was William
F. Denning, who, between 1869 and 1898, observed 2409 Perseids
and became the first person to derive a daily ephemeris of the
radiant's movement. In 1901, he published his most precise
radiant ephemeris as follows:
| Date | RA (deg) | DECL (deg) |
|---|---|---|
| July 27 | 27.1 | +53.2 |
| July 29 | 29.3 | +53.8 |
| July 31 | 31.6 | +54.4 |
| Aug. 2 | 33.9 | +55.0 |
| Aug. 4 | 36.4 | +55.5 |
| Aug. 6 | 38.9 | +56.0 |
| Aug. 8 | 41.5 | +56.5 |
| Aug. 10 | 44.3 | +56.9 |
| Aug. 12 | 47.1 | +57.3 |
| Aug. 14 | 50.0 | +57.7 |
| Aug. 16 | 52.9 | +58.0 |
[A recent plotting of 102 precise photographic meteor orbits by
the Author supports the general accuracy of the above ephemeris
with the daily motion of the radiant being computed as RA=+1.40
deg, DECL=+0.25 deg]
In addition to this main radiant near Eta Persei, there have been indications that several secondary showers are also active. Minor activity near the main Perseid radiant has been noted on several occasions up to the present time and may have been noted as long ago as 1879, when Denning pointed out that he had "detected the existence of two other simultaneous showers from Chi and Gamma Persei." This latter shower is one of the most active of the secondary radiants and seems to have been frequently observed during the twentieth century---especially with telescopic aid. The following observations represent some of the details.
One of the most recent examples of the complexity of the Perseid meteor shower was revealed in three studies of the radiant conducted during 1969 to 1971, by observers in the Crimea. In addition to the main radiant near Eta Persei, they confirmed the existence of the major radiants near Chi and Gamma Persei, as well as minor radiants near Alpha and Beta Persei. These meteor showers are generally short-lived and possess radiants that move nearly parallel to the main radiant. The following are summaries of the most consistent of the secondary Perseid radiants.
These secondary centers of
activity have been predominantly visual displays; however, time
was taken to seek out some of these other radiants during the
Jodrell Bank radio-echo survey of the 1950's. Only the Alpha
Perseids were noted with confidence. Detected in both 1951 and
1953, the radiant was very diffuse and 8 deg in diameter centered
at RA=54 deg, DECL=+48 deg. It was detected between August 8 and
11, and the highest radio-echo rate reached 37 per hour (the main
Perseid radiant reached radio-echo rates of 50 per hour during
the same years).
Other studies conducted by amateur
and professional astronomers during the last 30 to 40 years have
involved specific details of shower members. One especially
interesting statistic that has been brought forward was the trend
that the Perseids seem to be brighter before the date of maximum
than afterward. In 1953, A. Hruska (Czechoslovakia) found the
average magnitude to be about 2.5 during August 8 to 12. However,
on August 12/13 it had dropped to 2.8 and by August 14/15 it had
fallen to 3.4. In 1956, Zdenek Ceplecha also showed a similar,
though less pronounced decline in brightness. During August 4 to
10, the average Perseid was near magnitude 2.68, while during
August 10 to 15 it was 2.94. The extremes came on August 6/7
(magnitude 2.31) and August 13/14 (magnitude 3.18). Just as
Hruska and Ceplecha's studies show conflicting patterns
representing the decline in the Perseid magnitude distribution
during August, two very recent studies seem to support both
views.
During 1983, members of the
Spanish astronomical group Agrupacion Astronomica Albireo, under
the direction of Eduardo Martinez Moya, obtained an excellent
series of Perseid magnitude observations, which seemed to support
Hruska's study. Between August 1 and 13, 1983, the average daily
magnitude varied from 1.75 to 2.04. Thereafter, it dropped to
2.19 by the 14th, 2.52 by the 15th, 2.77 by the 17th, 2.92 by the
19th and 3.45 by the 20th. Robert Mackenzie (director of the
British Meteor Society) claims the magnitude distribution of the
Perseids "gives an indication of the particle mass variation
in the cross-section of the stream encountered by the
Earth." This variation seems to support Hruska's study.
Another excellent series of
magnitude estimates were made by Paul Roggemans (Brussels,
Belgium) during July 27 to August 16, 1986. Observing in darker
skies than the Spanish group, Roggemans detected 1315 Perseids
and gave the average magnitude of the shower as 3.10. Roggemans'
estimates were very consistent throughout the shower's duration
with variations being typically less than 10% on any given day.
However, there were two exceptions. The first came on August 5/6
and 6/7, when the average magnitude dropped to a low of 3.54. The
second drop occurred on August 9/10 and 10/11 when the average
magnitude reached 3.71. This set of observations seems to support
Ceplecha's study.
All of the above magnitude studies
(and many more not discussed here) have one thing in
common---they point to an irregular mass distribution within the
Perseid stream. Filamentary structure seems the best explanation.
During some years, the filaments are encountered in rapid
succession by Earth's passage through the Perseid stream, thus
accounting for the consistent magnitude estimates followed by a
steady decline. In other years, the filaments are spread out
across the stream's width, thus causing the consistent average
magnitude estimates to be disrupted by periods of activity from
primarily brighter or fainter meteors.
Another statistic that has been
brought forward during the last 30 to 40 years has been the
percentage of Perseids that exhibit persistent trains. This is a
major factor long noted in the separation of Perseids from other
active showers occurring during the first half of August.
Miroslav Plavec used the records made at the Skalnate Pleso
Observatory (Czechoslovakia) to produce one of the most ambitious
studies of train phenomena to date. He studied 8,028 meteors
observed between 1933 and 1947, and found the following
percentages: 45% possessed trains in 1933, 60% in 1936, 35% in
1945 and 53.5% in 1947. The variations could not be correlated to
sunspot numbers. Taking an average of meteor train activity noted
in various publications between 1931 and 1985, the author has
found the average value to be 45% for nearly 60,000 meteors.
More orbits have been computed for the Perseids than for any other meteor stream, with the first coming during the early 1860's. During the last few decades photographic and radio-echo techniques have enabled the first precise orbital determinations. The Perseid orbit below was derived by the Author from 102 precise photographic meteor orbits accumulated from surveys conducted in the United States, Soviet Union, and Czechoslovakia. I have also included the orbit of periodic comet 109P/Swift-Tuttle.
| Perseids | Swift-Tuttle | |
|---|---|---|
| Argument of Perihelion ( |
149.2 deg. | 153.00 deg. |
| Ascending Node ( |
140.2 deg. | 139.44 deg. |
| Inclination (i) [J2000] | 113.2 deg. | 113.43 deg. |
| Perihelion Distance (q) | 0.942 AU | 0.958 AU |
| Eccentricity (e) | 0.902 | 0.964 |
| Semimajor axis (a) | 9.641 AU | 26.317 AU |
C&MS Home | Calendar | Meteor Information | Meteor WWW Links | Glossary
If you have any questions, please email me