| Measure key spectral features |
 |
| To achieve the conquest of spectrometry, here are some examples of scientific measurement which can be of interest. They mainly apply when the resolution is high enough to see that the line profil is the real line profil and not driven by the instrument itself. |
 Doppler-Fizeau effect Doppler-Fizeau effect |
As light is just about waves, the color of light which is equivalent to its wavelength as an audio wavelenght may be perceived diffferently depending of the speed and the direction of the wave reagrding the observer.
- When wave come toward the observer, the perceived wavelength is shorter as the speed increase.
- When wave goes away, the perceived wave lenght is longer and this also is proportional to the speed.
The Doppler-Fizeau "Shift" is mathematically written as : Delta Speed = (Delta Lambda / Lambda) * Speed Light
|
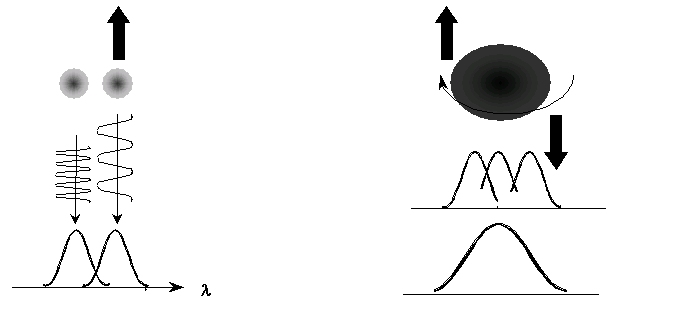
| When an object is animated of a movement at a significant speed, the Doppler effect produced a shift in the observed wavelenght of the element. |
In the case of a rotating object, the part which moving toward the observer is seen in the bluest part and the part which goes away in the redest part. The combinaison of these effects on the all object produce a spread of the width of the line. |
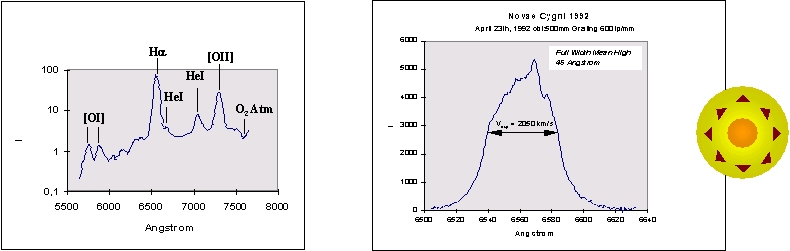
The consequence of this physical law is the basic of a lot of astrophysical measurement like the speed of the extension of a shell during a nova explosion as in the example below, or used to determine the spectral shift of sub-components in line profil.
- Nova Cygni 1992 - the shell speed has been mesured at 2050 km/s which was confirmed in a UAI bulletin.
|
| Line Width Equivalent |
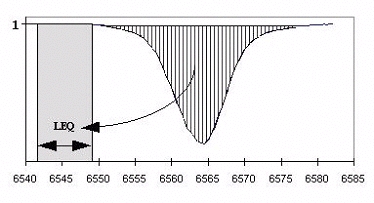
| When looking at line profil, it is also of interest to quantify how "strong" is the line. This measurement is used as an example to compare evolution of the line strenght over the time. The strenghtness of a line is calculated as the area which undergoes the line and is normalized as a wavelength unit.
|
|
|
|
|
|
|
 |
|
|
|
|
 |
|
|
|
The Equivalent Width must be performed on a normalized spectrum. The normalization process consists of dividing the spectrum intensity by a constant which the mean continuum value of a spectral region where no lines are present. |
|
|
|
|
|
|
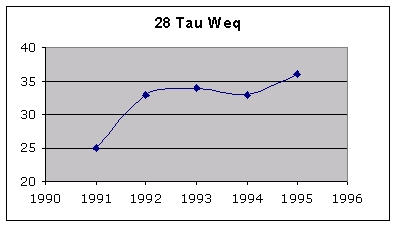
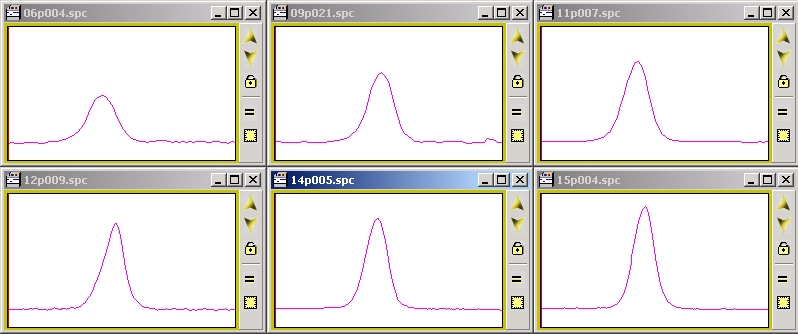
- 28 Tau - Be Star, H-alpha Equivalent Width evolution
|
|
|
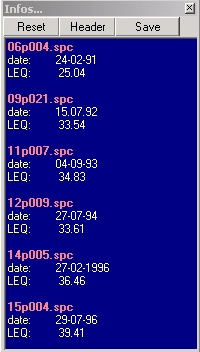 |
In this example, all the spectrum are normalized on the same spectral region. If the Width Equivalent would have not been calculated, no evident line modification would have been noticed.
But, by looking at the value over time, it can stated that the strenght of the H-alpha line was increasing over the period of 92-96.
|