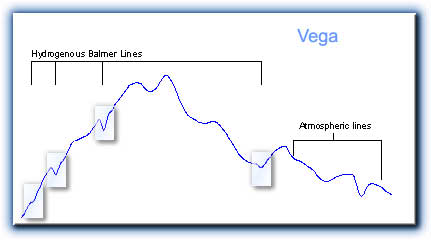
Once the star light is dispersed as a band arranged by wavelenght in an image, the path is set for spectral analysis. All the astrophysics enigma can be revealed if some basics steps are followed.
Spectroscopy is a technic which brings you up above the traditional imaging technic. Once the spectrum has been acquired, you may ask yourself: what can I do then ?

Visual Spec will assist you in every step, with adequate tools, user-friendly functions and database with more than 5000 atomic lines referenced and a library of about 130 different spectral types...

 
  • What's the difference between Image and Spectrum profile ?
    Spectral analysis does not involve image processings but classical data processings and graphics. Spectrum can be converted as an intensity curve where the vertical axis is the brightness of the spectrum versus the horizontal axis which is the wavalength of the light. 
    By analysis the energy repartition versus wavelength, chemics and physics rules provide tools to understand the environment which produced it.

  • With almost no processing...
    It is possible without any correction or calibration to recognize key spectral lines in a medium range spectrum.
  • But if you open the wavelenght window...
    By doing this simple operation, most of the standard spectral functions can take place and measurements can be performed extending the numbers of applications.