| Identification of chemical elements is one of the most difficult adventure in spectroscopy for amateurs. At the low resolution of our images, we usually cannot determine with enought accuracy which element has produced the line. Each wavelenght is supposed to be the signature of only one electronic transition which belongs to one specific atom. In case of molecules, it is even more difficult as molecules transition bands absorbtion on multiple modes... |
| The first key enabler is to get access to a library of lines per elements. Visual Spec does embed such library, up to the Iron (Fe) atomic element. But you will see that even with this nice tool, identification of lines is not easy... but let's try to demosntrate some of the possible strategy Visual Spec can provide you ! |
| Let's display first the spectrum, correctly calibrated in wavelength - the spectrum below is one of planetary nebulae, M57 |
 |
| First basic thing can be to select the line by clicking and dragging by maintaining the left button |
 |
| Then, click on the right mouse button, and in the pop-up menu select the label item - When releasing, the wavelength of the line center is displayed on top of the line. If you have a big book with lines wavelength you can search for the element which exhibits lines at this wavelength. |
|
|
| A simpler strategy can be used using the element library available - Go in the tool menu and pick the element item. |
 |
| A new window will appear, with all the library lines which are contained in the spectrum wavelength domain |
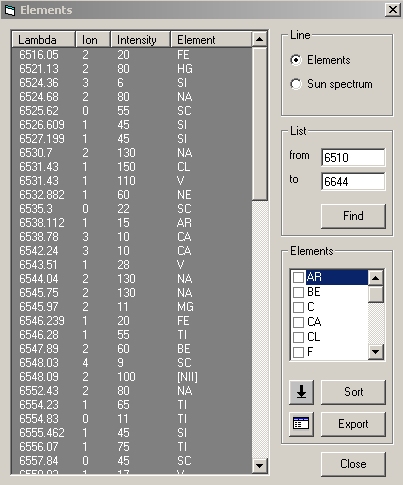 |
| Put the cursor on the line you want to see and click, the red line cursor in the spectrum document will be moved at the line positin in your spectrum. Use the arrow up and down to scroll from line to line and see which other element can correspond... As you scroll in the full library, you will see that plenty of lines can match the spectrum line... How would you know which one is it ? |
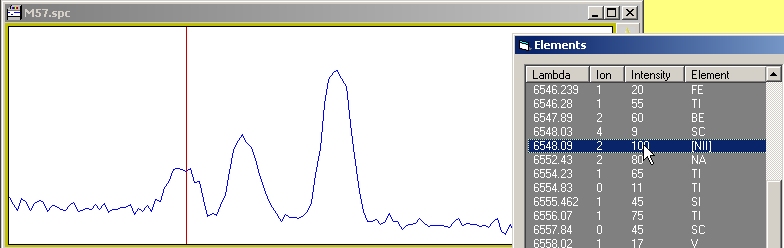 |
| Here is where the science comes... you know that you are looking at planetary nebulae, so, only some lines are present - Eliminate metal lines, or seldom elements, and look on the web or in book to know more about the physic of such nebulae - You will learn the story of the forbidden lines and how the first astronomers were fooled by physic when trying to identify these lines... Forbidden lines are always note with [] symbol, as you see the [NIII] element in the list, can it be the one ? |
| Select the zone where the lines are on the spectrum, then click on the element window then move the cursor back on the spectrum document - As the cursor change position, some lines will be highlighted in the element window. On one the line, you can see the [NIII] line beeing highlighted. |
 |
| Go back in the element window, and scroll the list of elements to see the [NIII] item. Select it by clicking on the small square |
 |
Then click on the sort Button, only [NIII] lines will be shown in the line list

Click on the export button...
|
 |
|
| A synthetic spectrum of [NIII] transitions will be superimposed to the origianl spectrum and ine match on th etwo lines clearly reveals that the two emission lines are the [NIII] ones ! |
 |
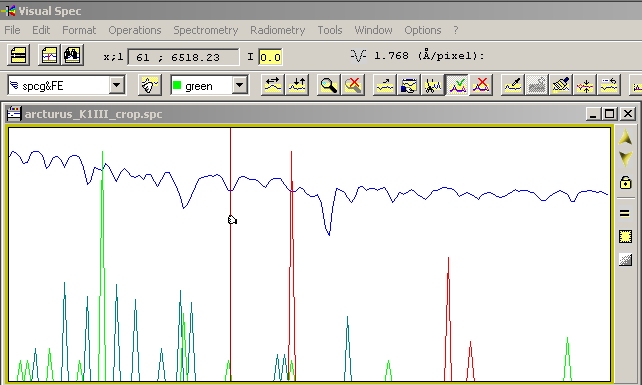
| You can play this game with different element, on a more complex spectrum and try one after one some lines which are listed in the litterature - In the above example, the Arturus spectrum shows multiple lines and we superimposed synthetic spectrum of Fe, Mg, and Ca. Some lines match, even with several elements, and it is not possible at this resolution to recognize with certainty the element... |
 |
| At each exportation, a new serie is added in the spectrum profil document with the name spc&"element symbol" - if you do multiple exportations, you can still go back in the series drop-down list to pick the one you want to activate. |
 |
| After an exportation, you can still go back to all element library by clicking on the reset button |
 |
| In the list of the lines, the lines are present by ascending wavelenght - you can change it by ionizing level by clicking in the ion column - you can also delete lines by selecting it and press the delete keypad button - this is temporary deletion, next database loading will refresh the all lines... |
 |
| When the spectrum shows very complex line structure, superimposing element lines may be confusing - The following spectrum if from Jupiter, made by Don Mais (US). |
 |
| A possible strategy is to display the element window, then select the line you want to identify - only the element which have transition wavelength are listed in the window - Usually multiple element lines are listed and you can try to guess which one is the right one. When an element is identified, it usually have oher lines at other wavelength as electronic transitions are linked due to line generation process - Make another selection on another line and continue the identifiaction process... |
|
|
| The last usage you can done with the element library features is to help to recognize lines in an uncalibrated spectrum - below is a non-calibrated spectrum from Vega. One expects to have mainly Hydrogren lines - but which ones is each ? |
 |
| As the spectrum is not calibrated a warning message is displayed when trying to get the elements list. |
 |
| The all library is displayed... Select the H element to only display the H-lines |
|
|
| click on the "export as a document" icon button - a new profil document appears with the H-lines synthetic spectrum - we can guess that some lines can match but the H spectrum shall be displayed with the right zoom coefficient and the right domain wavelength |
 |
| Since 2.0.6 version a new interactive zoom function is availlable to ease the matching process |
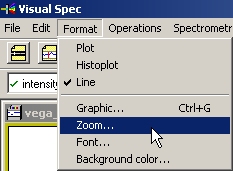 |
| A dialog box appears with two cursors: one adjusts the zoom factor and the second adjusts the wavelength domain |
 |
| Move the curors until the lines sequence match the lines sequence of the un-calibrated spectrum |
 |
| Once the patching process seems to fit the orginal spectrum, you have identified the un-known lines by looking at the true wavelentgh and start the calibration process |
 |


