| The profile obtained represents the intensity of the "color" for each color of the object. But, the receptor used, the CCD camera or other, may have its own color sensitivity and will modify the profile intensity. This difference in intensity is quite slow in change versus the wavelength, so there is no risk this could create false lines. But the poor sensitiviy if the CCD in blue for example modifies so strongly the profile continuum that it is hard to identify the spectral type of a star if no correction is appplied. |
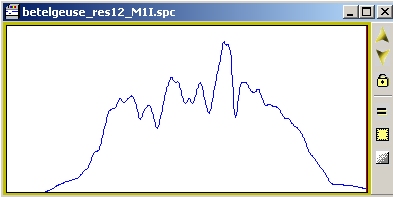
| Below, is the raw profile of Betelgeuse, a M-type star. Red is rigth, and as any M-type star, one should expect that red domain would be the highest in intensity. Which is not the case. |
 |
| At the end of the process, you will get the "true" planck profile of the star, in blue below. |
 |
| To make that happen, we shall find the CCD response. The CCD response will represent how sensitive the CCD is in each wavelength. Once this response curve is obtained, it will be used to divide each raw spectrum by this response to compensate the CCD response. |
To obtain the CCD response, there are severals possibilities:
By calibrating versus a standard spectrum of equivalent spectral type from the reference library
By calibrating from another star
The first one is the easiest way to go as it does not need extra acquisition. The second one is used when the CCD response has already been obtained and goes much faster. But the overall priniciple is the same. In these cases, every intensity will stay relative to each other. There is a way to calibrate the absolute flux, and this will be shown further in the lesson.
|
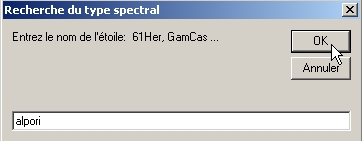
| Once the raw profile is displayed, and calibrated in wavelength, if the spectral type is unknown and if it is a star, you can go in the tool menu to get the spectral type. (extract from the bright star catalog). |
 |
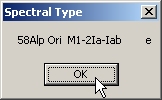
| Enter the name of the star with no space, and by using the first 3 letters for the greek letter and the 3 letters of the constellation, or the star flamsteed number with the 3 letters of the constellation. Here, Betelgeuse is alp(pha) Ori which translate into alpori. |
  |
| Keep the spectral type in mind, and get from the standard library the spectrum profile of the same spectral type |
 |
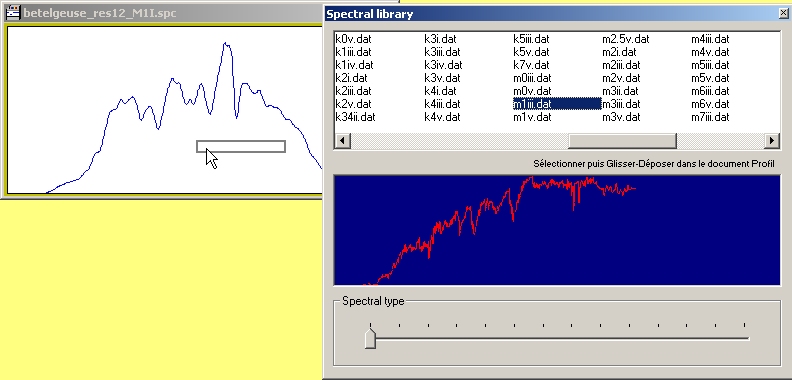 |
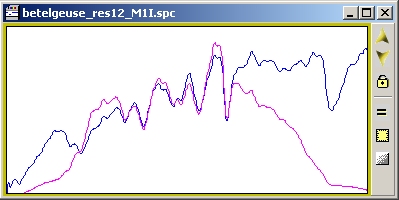
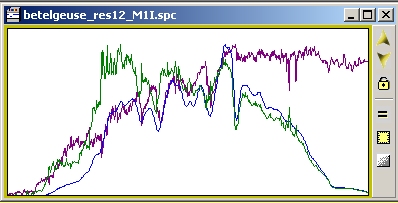
| Drag and drop the standard spectrum on the profile window to superimpose the "what shall the truth" on "what my CCD recorded". |
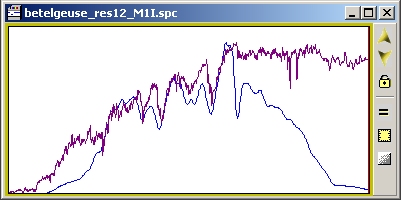 |
| At this point it is obvious to see that CCD was not recording properly the "far-red" domain and the "green-blue" domain. This indicates that the raw spectrum shall be enhanced on these regions to compensate the low gain of the CCD at this wavelenght. Why division and not subtraction ? because this is a gain correction, like a flat-filed in standard image processing. It is not an offset correction. This processing is a "flat-fielding" processing, but a spatial one, a "color domain" one... |
 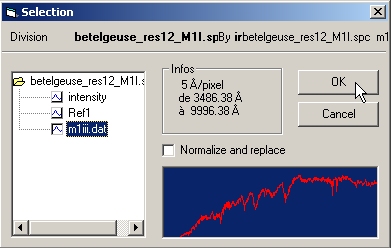 |
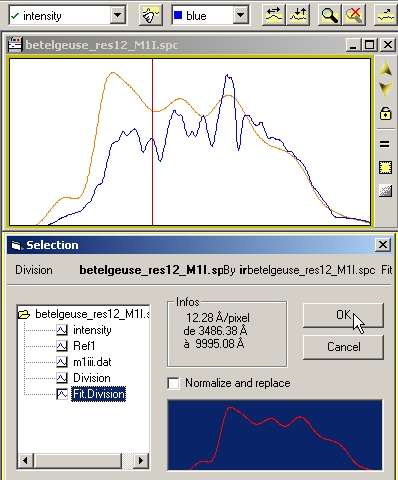
| The result of the division is displayed as a green profile. The serie name is "Division". |
 |
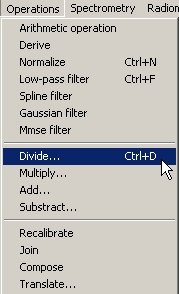
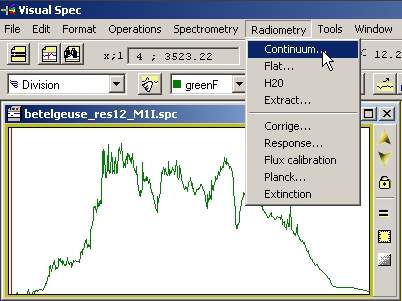
The resulting profile exhibits lines which are present in the spectra. To get the CCD response which changes slowly with wavelength the lines shall be eliminated by getting to the continuum profile of the spectrum, with no lines.
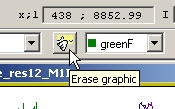
First, one can clean the graphic by erasing all series displayed and reselect the division serie. Then start the continuum extraction process. |
  |
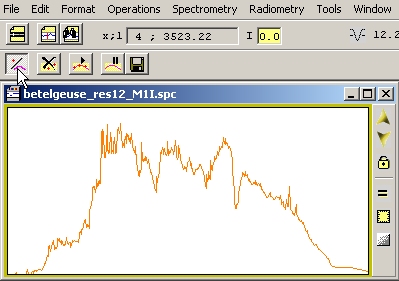
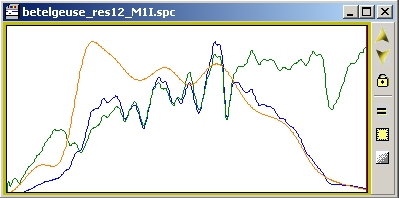
| An orange profile is superimposed and a new toolbar is displayed. If you toggle the point/zone button you can either select points to build the contiuum or erase profile zone where lines are. |
 |
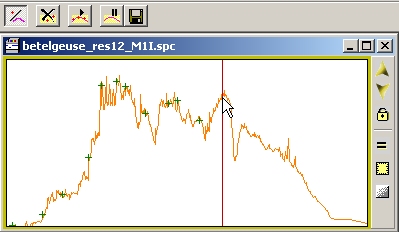
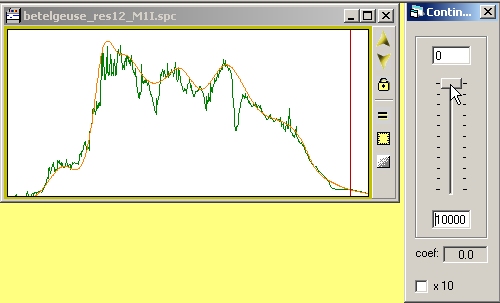
| If you selected the point mode, then click on the spectrum to place points where the continuum shall pass through.Make sure these points are on the object continuum and not on lines zone. |
 |
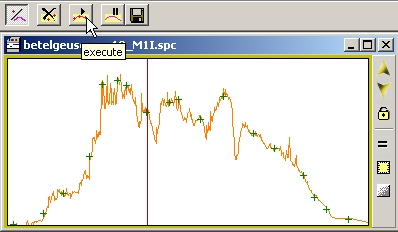
| Once the set of points is selected, run the smoothing process |
 |
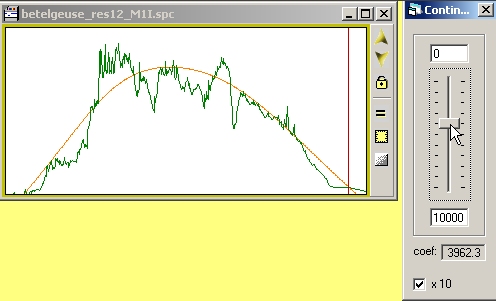
| Adjust the smoothing coefficient to fit the continuum at the best. No lines in the profile, but slow change of profile intensity captured. |
 |
| This is too much smoothed, and will not perfectly represents the CCD response changes |
 |
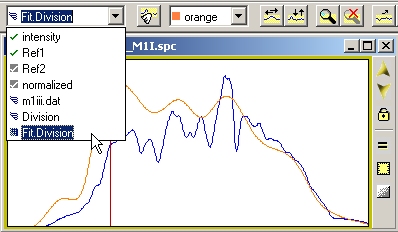
| When the correct fit is obtained, the result is in the new fit.division serie. This is the CCD response curve. It can be stored separatly as a stand-alone profile document as a falt-field and can be used to correct CCD response for any other stars acquired under the same conditions (telescope, camera, spectroscope) |
 |
 |
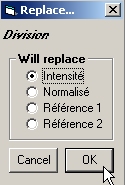
Select the fit.division serie, and replace the intensity serie by this one. Then save the file under a new name to not erase the original one ! Pick a name like "Response"... |
 |
|
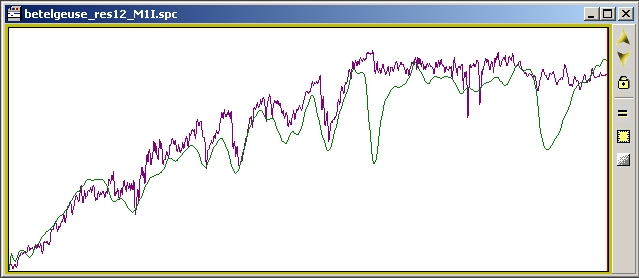
| To get to the true Betelgeuse spectrum, the raw profile shall be divided by the CCD response in the fit.division serie. |
 |
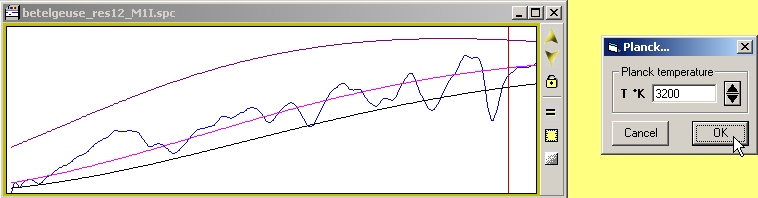
| The result is your acquired spectrum of Betelgeuse corrected from the CCD response. On the rigth, the corrected profile is in blue. |
 |
| If you superimposed again the spectrum from the standard library, the 2 profiles continuum shall looks the same. |
 |
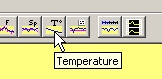
| Now, you can try to get the continuum temperature by fitting the planck curve. Each star can be assimilated to a Black-Body object and its continuum shall have a peek of intensity at a color which is only dependant of the balck-body temperature. This is the Planck Law. If you click on the temperature button, you can enter a temperature in a dialog box and see a new serie added wich is the planck calculated profile at this temperature. By "trial and error", you can find the temperature which produce a profile which fits the best the observed continuum and so, deduced the star temperature... |
  |
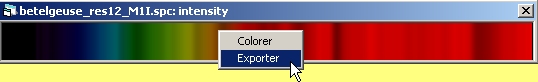
| Other function available is the generation of a synthetic image of the spectrum. People can e more sensitive to spectrum image than to rofile curve. So the synthetic function generates a bitmap image which matches the profile intensity and expand it over the vertical axis. |
 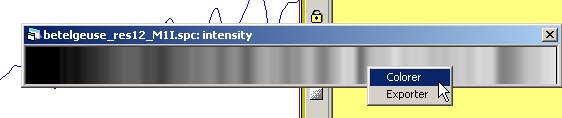 |
| As the profile is calibrated in wavelength, a true color can be assigned to each wavelength... and such produce what's the human eye could have seen. Here, we have the confirmation that Betelegeuse is a red star.... |

You can then export as a bmp file the produced image.
|