| Getting spectrum profiles correctly calibrated and corrected is only the first step. Spectroscopy gives access to astrophysical data and measurements which complete the spectral analysis. |
|
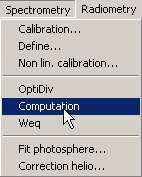
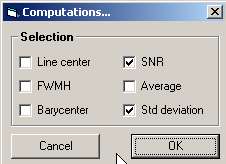
To get the width of the line at mid-heigh (FWMH) you have to select the line and get into the computation dialog box
|
 |
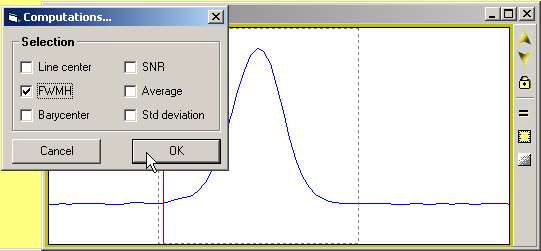
Among the different computation available, select the FWMH |
 |
|
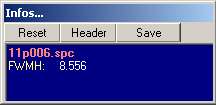
| The results will be displayed in the infos... window - you can save the content in a text file named infos.txt |
 |
| The best example of the utility of such computation is the measurement of the speed expansion of the shell in a Nova spectrum. |
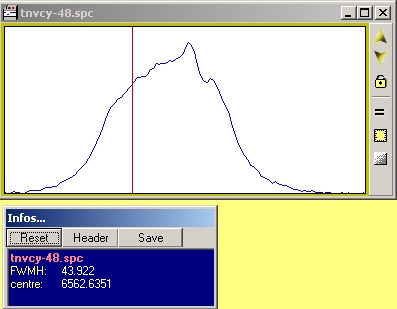 |
The doppler shift is produced by the shell expansion, and the velocity of expansion is then related to the FWMH by the doppler equation:
delta(lambda)/lambda ref * c = V
c=speed light, 300 000km/s
lambda ref = 6562.63 angströms
with delta(lambda) = FWMH
The above equation gives:
V=2004km/s with an error of 100 km/s
At the same time, a UAI note indicated a speed expansion of 2050km/s...
|
|
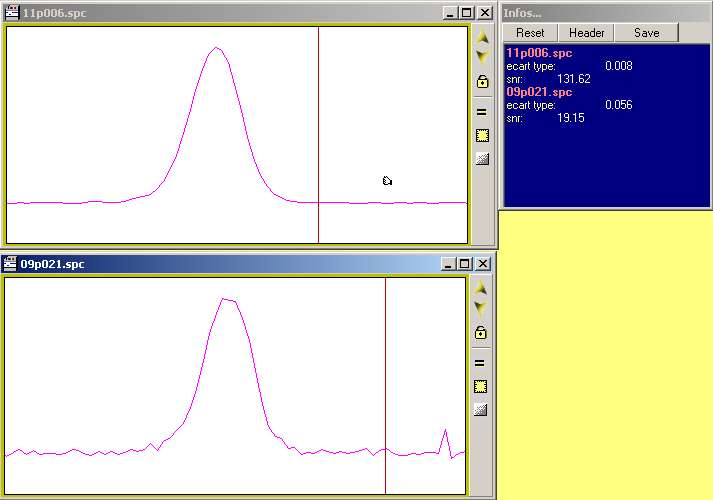
| Another set of computation can be useful to assess the quality of the spectrum by computing the Signal to Noise ratio |
 |
| In this example, the values of the snr clearly confirms that the first spectrum has a much better quality with a greater SNR than the second one. |
 |
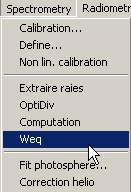
| In spectroscopy, to measureand compare the line force, spectroscopists use the Width Equivalent which represent the power of the line. Again, the computation requires you to select the line yo want to measure |
 |
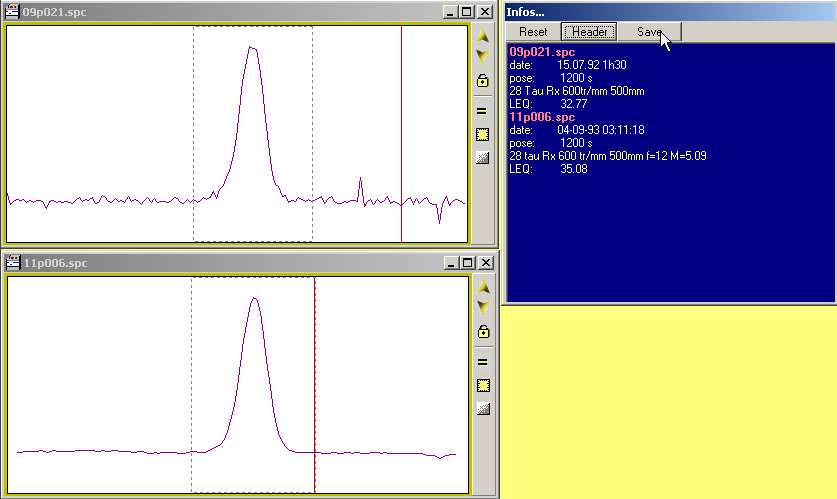
| If you study spectra profile over time, you can display the header data then the WEQ (or LEQ) in the infos window, then save the results and build a graph that shows the WEQ evolution over time. |
 |
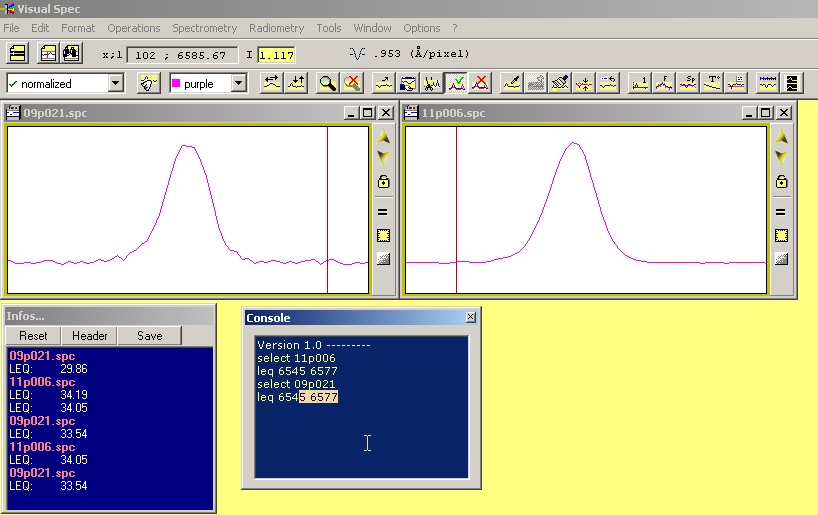
| As most of the line selection is made manually, some errors can be driven by a non homogenous zone selection when comparing values from different spectra. Vspec has a console with some clasical commands which allows you to perform the same computation and indicates the exact wavelength domain where you want to make the measurement. |
 |
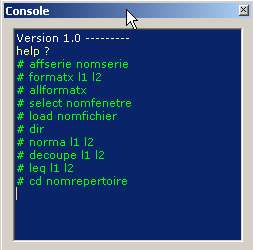
To get the list of the possible command and their parameter description, please refer to the Vspec user manual.
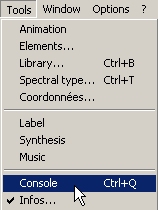
The help ? will display the command list
|
 |
|
| Below is shown a command sequence to compute the WEQ on different spectra with no mouse usage |
 |