| Visual Spec 3.9.2 - 3.9.7 |
 |
Mouse Wheel 
Visual Spec is now responding to mouse wheel in the two following cases:
Open an image, click in the image and use the mouse wheel to reduce or enlarge the thresholds window. A reduced window width will increase the contrast.
Open a profile, click on the profile at the position you want to keep centered. Use the mouse wheel to zoom around this position. you can always revert to the original display with the "unzoom" button. if no profile position has been indicated (by a simple click) the zoom will be centered on the middle of the profile.
|
Display Positions next to cursor
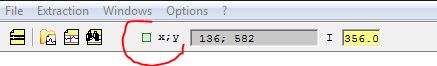
If you want to have the display of the X, Y position of the cursor next to it, click on the small square next to the X,Y label in the toolbar.
If the mouse is over an image, it will display the X,Y coorinates.
If the mouse is over a spectrum profile, it will display the pixel and its wavelength. The wavelength is zero if the profile is not calibrated.
|
Image sky background subtraction
If you want to subtract the sky background above and below the spectrum, there is now a new button in the toolbar

A new dialog box will be displayed
The algorithm can find automatically the spectrum if there is only one spectrum in the image. But if you un-select the Auto mode, enter the Y position of the middle of the spectrum in the image.
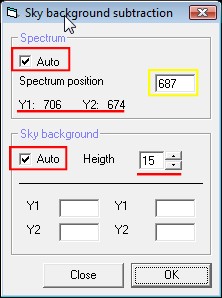
The sky background correction compute a column by column average value from two regions above and below the spectrum region. The width of those windows can be modified. This profile can be assimilated to the sky spectrum and is then subtracted as an offset to the entire image.
If the auto mode is selected, Visual Spec will pick two sky regions at 10 pixels above and below the profile region.
If the auto mode is unselect, enter the Y top and bottom coordinates of the two prefered regions.
|
Image raw profile extraction
This function extract and display the profile of the spectrum from one image. Go in the menu Extraction>Basic profile extraction.

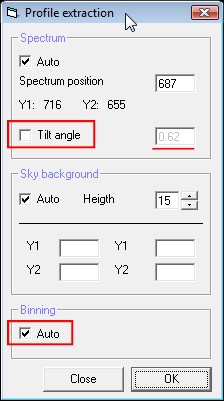
The dialog box is similar to the sky subtraction box. The two additional functions are the tilt correction and the binning profile extraction. If the tilt angle mode is selected, Visual Spec will compute the rotation angle along the horizontal axis. The value found will be set in the text field next to it. If unselected the text field is active and the angle value will be the one entered in the text field.
The binning auto mode will use the specific binning algorithm of Visual spec which retains only lines which contains signal. If the auto mode is unselected, a classic sum is made column by column in the region around the spectrum defines at the beginning of this process.
The raw profile is displayed in a profile document. The resulting profile is the spectral profile, but not yet calibrated. The tilt angle is corrected, but not the slant, as this is not necessary for a such basic function.
|
Image basic calibrated profile extraction
This function extracts, calibrates and displays the profile of the spectrum from one image. It is based on the above described steps in the raw profile extraction with the addition of a set of field to perform a basic calibration.
Go in the menu Extraction>Basic profile extraction.

A dialog box is opened. On the left, the panels have the same function as in the function above. The right panel is for the basic calibration of the raw profile. To perform a very basic calibration you need to identify 2 lines and assign the wavelength to the pixel positions.
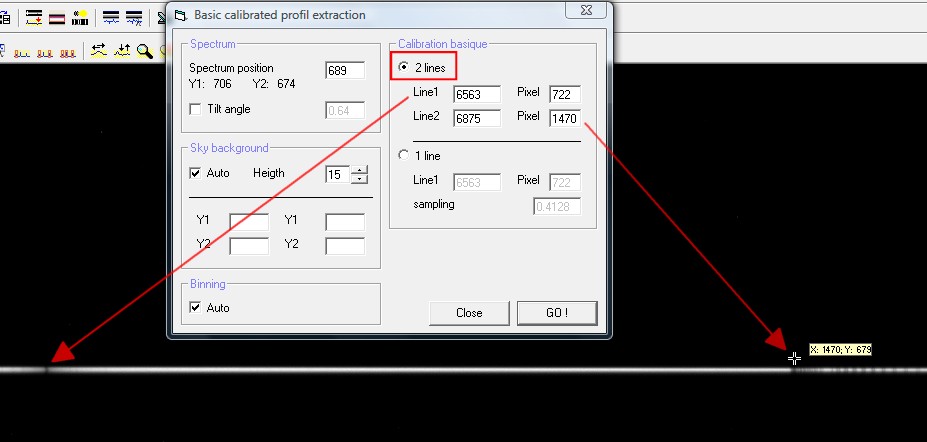
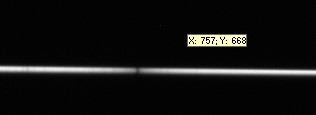
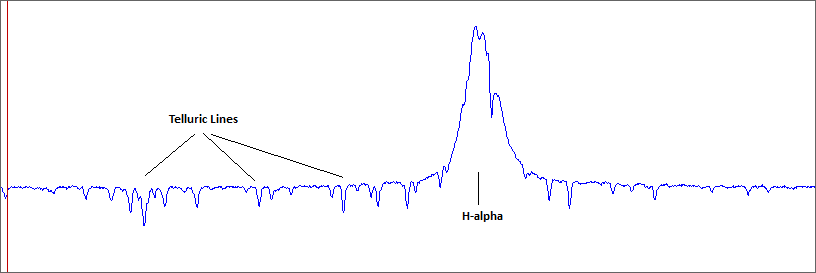
If you turn on the display X,Y position next to the cursor, you can move it on the image and see where are the lines. In the exemple above, the H-alpha line at 6563 is visible as an absorbtion line, and the first O2 atmospheric molecular absorbtion band is also visible on the right side. The first deep line position is used.
This calibration is very basic in a sense that it used pixel position of the line center defines visually by the user. The final calibration shall be made using the barycenter or a gaussian fit of the line, and more lines maybe used to really fit the dispersion law. In this case, a spectral reference lamp spectrum is used, and not the star spectrum itself. Star lines wavelength can be modified by the object radial velocity. At 6563 angström, 45km/s RV is equivalent to 1 angström shift.
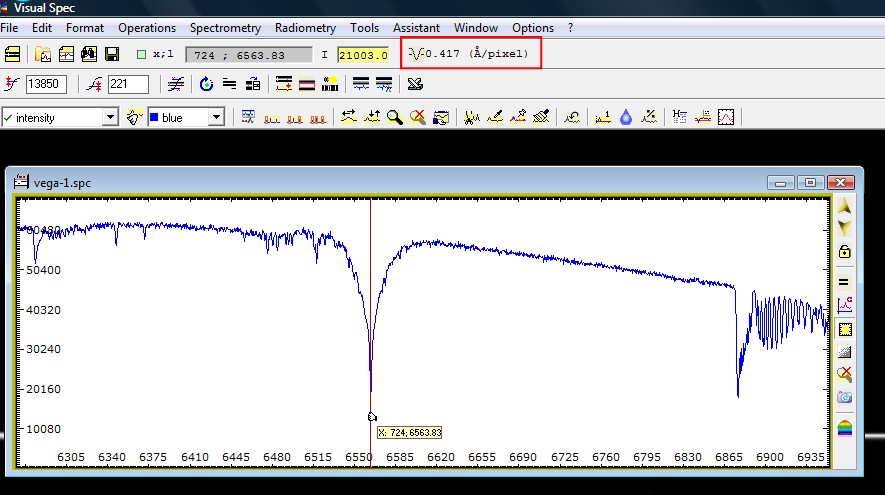
After the processing, the profile is displayed, the axis is graduated and the sampling factor is updated in the top toolbar.
I use this basic calibration extraction during my observing session. I usually process the first raw image of an object. As soon as the image is recorded, I open Visual Spec and perform the extraction. As I know the sampling factor of my instrument, I use the 1 line calibration, just indicating the H-alpha line position.
|
Spectrum profile basic linear calibration
The function can be found as a new button in the toolbar or in the menu spectrometry>basic calibration. A profile shall be displayed.

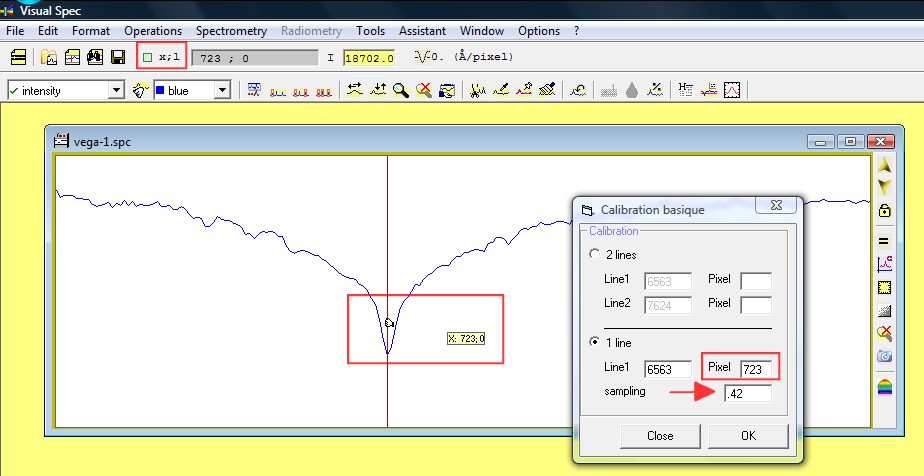
This function is vary basic. If you know the sampling factor of your instrument, you can simply assign a wavelength to a pixel value, enter the angström per pixel sampling value and get your profile calibrated. If you do not know the sampling factor, you will need to identify two lines and enter the wavelengths for each line positions in pixel, as described above.
If you turn on the "next to cursor" XY display, check where is the center of the H-alpha line. Enter the X coordinate into the box Pixel in front of the 6563 ang value, H-alpha wavelength. Enter the sampling factor, here 0.42 angström per pixel.
If you click in the Pixel box text field, then click on the profil, the X position will be automatically updated.
Click ok and the profile will be calibrated.
Remember, this is not very accurate calibration, as the center of the line is defined manually. For better performances, use the 1-line calibration function and select the line so the barycenter can de determined for better accuracy.
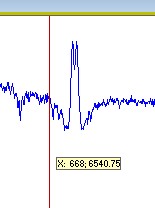
But you can also see the barycenter of a selected line from here.
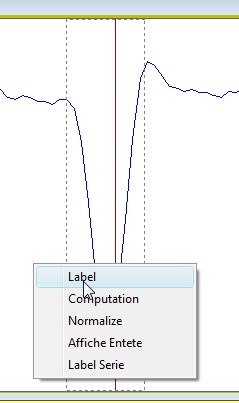
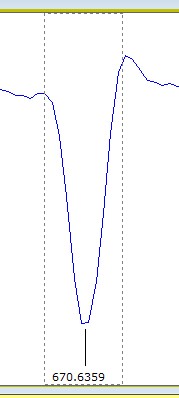
Simply select the line you want to know the barycenter (assuming your profile is not calibrated). Click the right button of the mouse, a popup-menu will be displayed. Select the label item. The barycenter will be shown under the line.
To erase label, click on the "refresh" icon in the side toolbar.
|
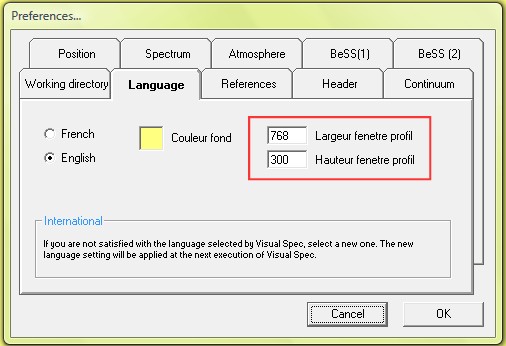
Default profile window size
As PC screen are getting larger, the default size of a profile document at opening can be now modified. Go in the preferences menu. Select the language tab. You can enter first the width, then the height, in pixels.
|
Image slant and tilt
Load an image.
Click on the "angle" button. It will compute the slant or the tilt angle.

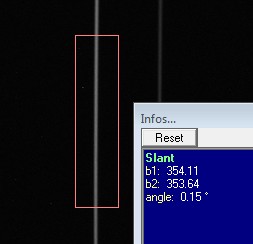
Slant
If you load a lamp spectrum, with vertical line, you can compute the slant angle by dragging the selection (right click of the mouse) around a calibration line. Make sure the rectangle is higher than its width. This will be the criteria used by Vspec to define if it has to compute a slant or a tilt angle.
The result is displayed in the infos window and the slant of the image is corrected.
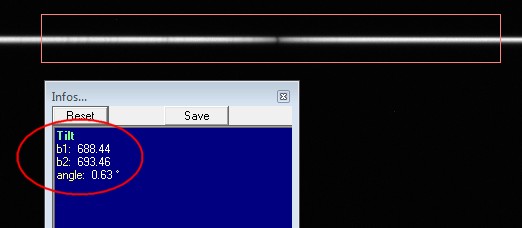
Tilt
If you load an image of an object spectrum, then drag along the spectrum, with a rectangle wider than its heigth. The tilt angle will be computed and the spectrum will be tilted by this angle.
Note: there is no possibility in Visual Spec to save images. Those image processing functions are only for a rapid evaluation of the spectra obtained, on a single image. And as the correction can quickly be re-applied, this not critical for this purpose.
For the true image processings and profile extraction and calibration of an image sequence, see the ISIS freeware, from Christian Buil.
|
Image rotation
Load an image.
Click on the "rotation" button.

It will open a new dialog box.
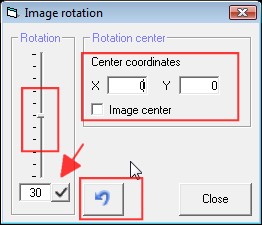
Enter the center of the rotation in X, Y coordinates. If you want to rotate around the center of the image, then click on the checkbox Image center. If you want to use the cursor to define the rotation center, click in one of the text field X or Y, then click in the image to get the cursor position loaded.
Enter the angle of rotation in the text field below the slider. To apply it, clcik on the checkmark icon, pointed by the red arrow.
To come back to the original image, click on the "undo" blue arrow icon.
You can enter negative value, and decimal value.
If you prefer you can use the slider. Click on its small cursor and slide it. The image rotation will happen upon releasing. Each time you click again on the slider cursor, the image will re-start from the original one. It is not good to perform multiple rotation on one image. The quality will be degraded.
The rotation process will make black areas appear on the side of the image. This can disturb the good functionning of function like automatic tilt correction. Better to put then a 0 tilt value and check the tilt angle box in Basic raw profile and Basic calibrated profile.
In general, applying a rotation is not appropriate. It will degrade the resolution. It is recommanded to align at your best the spectrum at the acquisition and use the tilt function to fix the residual misalignement.
|
Reading bmp files
This is work in progress function, but it shall be able to read bmp files as image.
In open image menu, in the dialog box, you can select fits, pic or bmp now as image format
|
Reading dat files
At opening of a .dat file, check the linearity of the wavelength values. if the mean standard deviation compare to a linear graduation is greater than 10%, Visual Spec proposes to resample it. In version 3.9.7 this feature is again removed... the criteria to decide if non linear is too difficult to adjust and the message is creating bugs. So, disabled again
|
Export png, jpg, bmp files
You can now export the content of a profile window as png or jpg or bmp image. It will keep axes graduation and all annotations.
|
Add annotations on profile
This is again some work in progress... on the side of the profile window, two new buttons can be found. One to add a line and one to add a text.
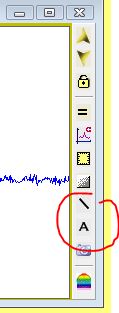
Click on the line button. Move the cursor where you want the line to start. Keep the mouse left button pressed and move to the end of the line. Release. If you want to modify the line, click on it and move one the 2 small dark dot. If you want to erase, click and press suppress buttton. If you want to add another line, click again on the line toolbar button.
Click on the A text button. Move the cursor where you want to put text. Replace the default text by yours. To select an annotation, click in it. Keep the left button pressed and move the text to another place. If you click on the small black dot you can resize the text. If you click with the right mouse button in a text selected you can change the text position (left, right or center) and change the police and color. If you want to erase the text, select it by clicking in it and press the suppress button.
|
Edit utilities files
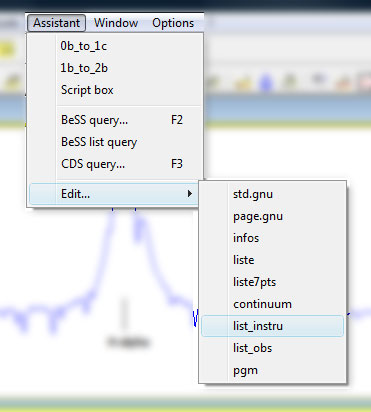
Visual spec is using some text file as utilities like the intru_text.txt file which is used to record all your instrument names or the observation site. You can also have direct access to the pgm (scripting) files or gnuplot templates etc...
In the assistant menu (a profile shall be opened) go to the edit menu and pick the file you want to edit. It will search and open notepad.exe to open the file.
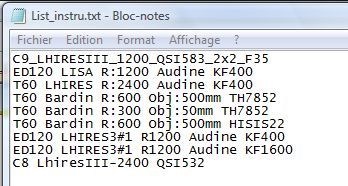
As a result the selected file will be opened. You can edit the changes and save it. In the list_instru.txt case, add a new instrument and it will be shown in the drop down list of instrument when exporting as fit for BeSS (ctrl W)
|
Automatic telluric lines suppression
This is a test. This function iterates (slowly) on the region 6540nm - 6552nm to eliminates the telluric lines. If the profile is perfectly calibrated (aligned with telluric lines to eliminate) this gives some pretty good result. But not all the lines can be corrected, some overshoot can be seen. This can be improved in the future.
|