Part 2 : Implementation and details of the measurement procedure
1) Acquisition tips
- The focus accuracy is critical. The camera lens is set to the infinite (manual focus) using Nikon Z6 electronic view finder magnifier.
- 14-bit RAW acquisition (no distorsion correction nor diffraction correction applied).
- A low ISO number is used to maximise S/N (no noise reduction applied).
- To reduce vibration, the camera is mounted on a tripod and triggered by a remote control.
- The measurement procedure involves measuring the fringe FWHM with the lens set at full aperture. Accordingly, the lens should be of excellent quality even at full aperture. Otherwise the FHWM will be overestimated.
- Furthemore, the focal length of the lens should be measured with some accuracy. This is easily done with Astrometry.net. For example, the focal lengths of the Nikkor 85 mm f/1.8 S and the Nikkor 50 mm f/1.8 were respectly measured at 82.9 mm and 51.9 mm.
- The Ha disacharge lamp has a rather short service life. Outgassing in the vacuum tube occurs from the electrodes. The tube progressively turns whitish due to additional emission lines. Outgazing does not occur while the tube is cold. So it is recommended to run the tube for 30 s max and let it cool down before a new cycle.
2) Measurement procedure
- The 14-bit RAW file is converted in 16-bit file with Adobe DNG converter.
- The profile of the fringes in red channel is analysed along the horizontal diameter (X axis).
- To increase S/N :
- A 20 pixels high slice is cropped from the image.
- In this cropped image, the curvature of the fringes is negligeable, allowing to average the columns (Y axis) in order to increase S/N.
- In this cropped image, the curvature of the fringes is negligeable, allowing to average the columns (Y axis) in order to increase S/N.
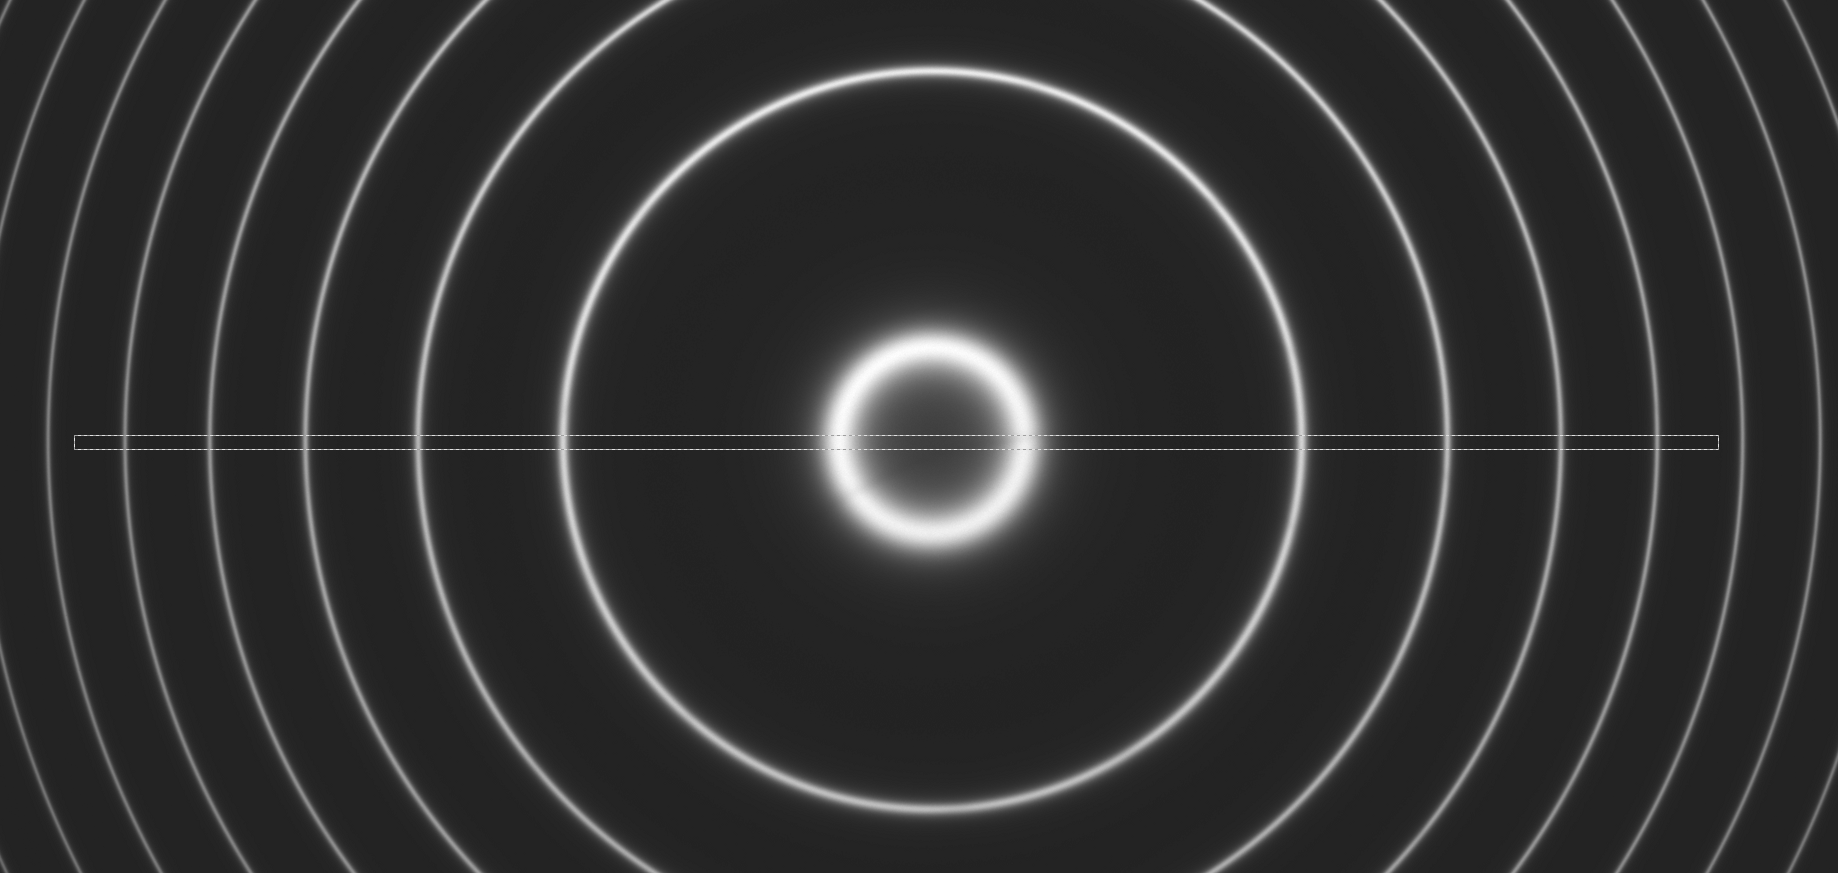
Coronado SM III 60 mm (tilt) - Nikon Z6 with 85 mm S f/1.8 lens at f/1.8 - 100 ISO - 1/2s - 14 bit acquisition - RAW mode - Red channel.
Cropping a slice of fringes along the horizontal diameter of the etalon. Note the central dip due to the CWL (red) offset at normal incidence.
Cropping a slice of fringes along the horizontal diameter of the etalon. Note the central dip due to the CWL (red) offset at normal incidence.
- The X profil of the cropped image is extracted.
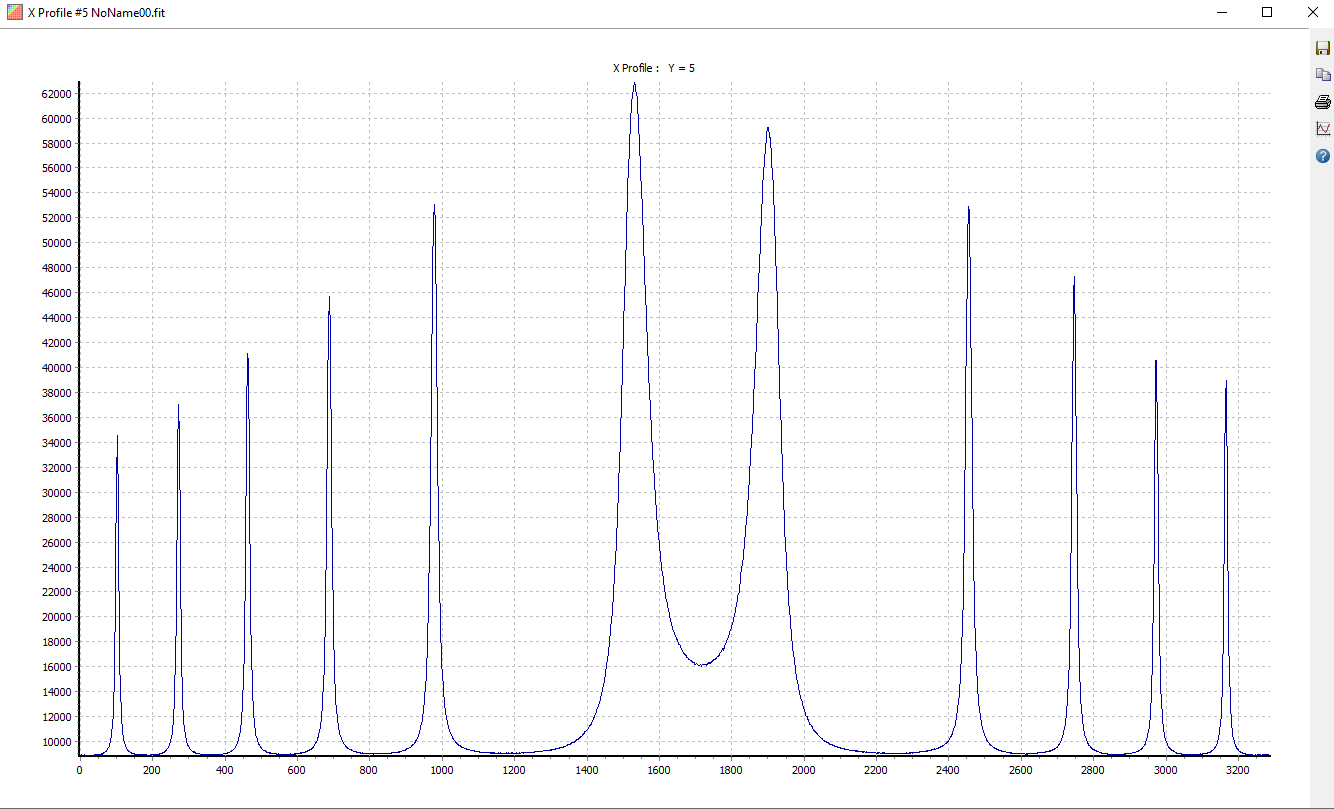
SM III 60 mm (tilt) - Nikon 85 mm f/1.8 S at f/1.8 - 100 ISO - 1/2s.
X profile along the 12 fringes central fringes.
X profile along the 12 fringes central fringes.
The profile and position of each fringe is measured with Fityk :
- The Airy function defining the F-P interferometer transmission with the incidence angle can be approximated by a Lorenztian function at each fringe.
- Accordingly, each fringe is least-squared fitted to a Lorentzian + linear function. The linear function is intended to model the background light.
- The FWHM and the center of the Lorentzian function are estimated by Fityk.
- The CWL offset of the etalon is calculated based on the radius of the central ring (if any) : delta CWL = i^2 / n^2, with delta CWL in A, i in degrees, n is the index of the gap (1 for air, about 1.6 for mica)..
- The FWHM and center of the other fringes are used to calculate the FSR and FWHM according to the formulae presented in part 1.
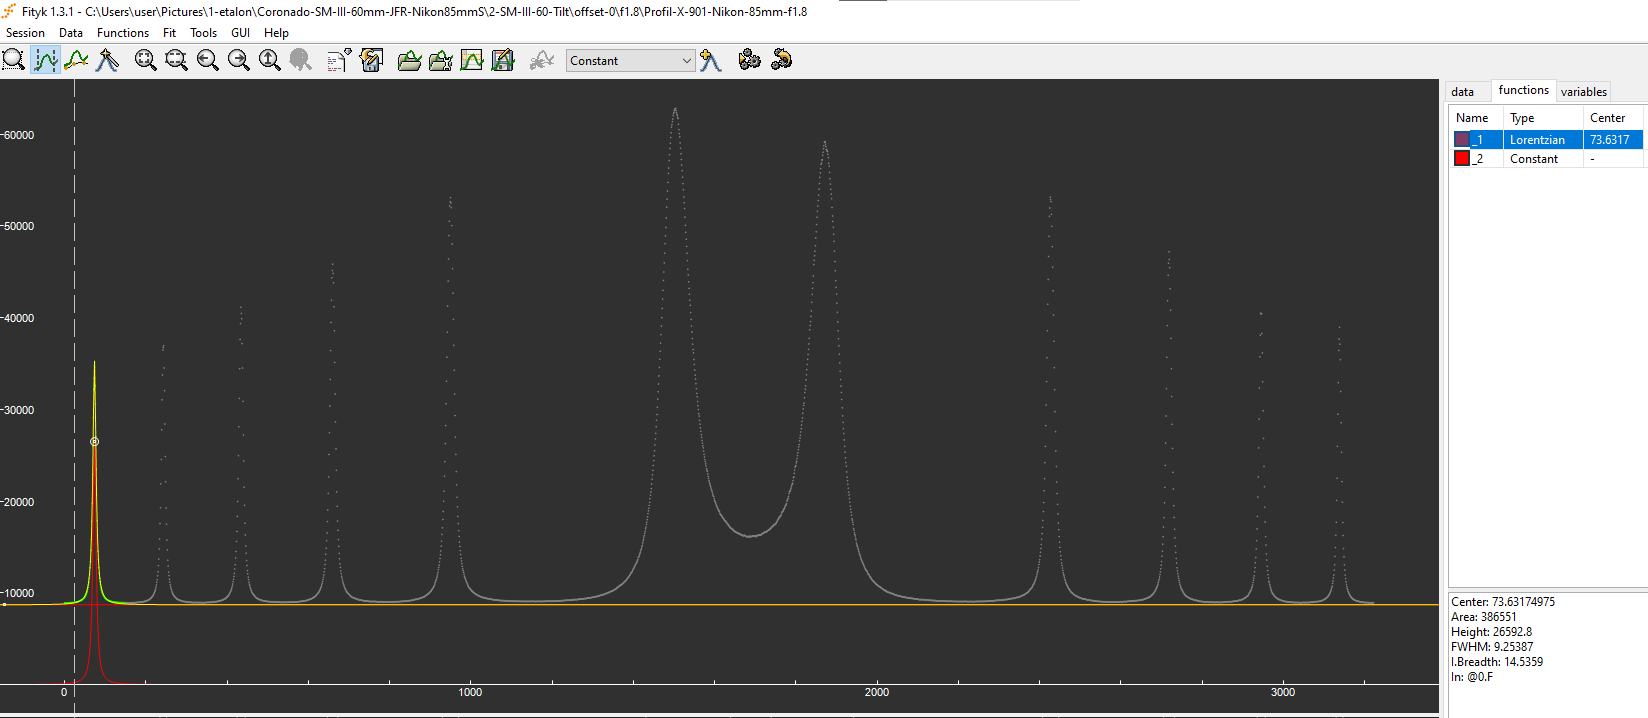
Fitting
a Lorentzian + constant function to fringe #1 Fityk. The
FWHM (9.2 pixel) and center (X= 73.6 pixel) of the Lorentzian is
extracted.
Special cases:
when the etalon is of average quality, the transmisison profile
can depart signficantly from a Lorenztian fonction. In these
cases, a Voigt function might be more relevant, or a split Lorentz, or
even a split Voigt (in very bad cases).3) Calculation spread sheet
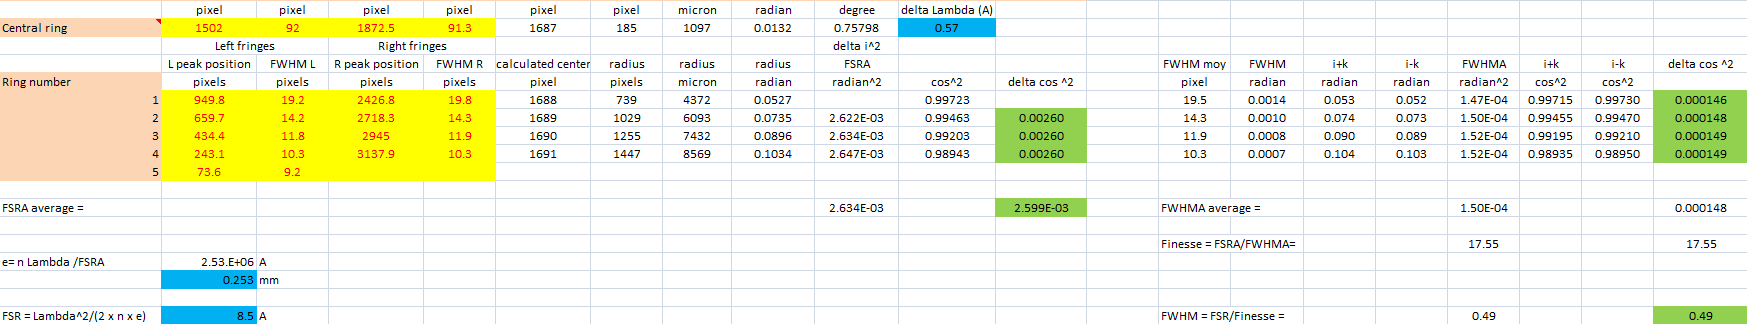
The following extract gives an example of calculation. according to the formulae provided in the theoritcal part.
(1) On the left side, calculation of the FSR:
- red color in yellow cells: measurements of FWHM and position of 6 fringes (left) and 5 fringes (right)
- calculation of fringe centers: used for checking
- for each fringe: radius of the fringe = 1/2 diameter
- for each fringe, calculation of the radius of the fringe i in radian (conversion pixel -> micron -> radian)
- for each fringe, calculation of cos^2 (i) (see explanations in the pdf)
- for each couple of sucessive fringes n, n+1, calculation of cos^2 (i) fringe (n+1) - cos^2(i) fringe (n) => this value is a constant (if measurements are accurate) => take average value over 3 couple of fringes => result is used to calculate the FSR in Angstrom : 8.5 A.
On the right side, calculation of finesse and FWHM:
- for each fringe, calculation of the average value of the FWHM of the fringe in pixel (left/ right), conversion in radian,
- for each fringe, calculation of angles i+k, i-k (see explanations in the pdf).
- for each fringe, calculation of FWHMA in radian^2,
- for each fringe, calculation of delta cos^2 (see explanations in the pdf) => this value is a constant => take average value over 4 fringes => result is used to calculate the finesse (=17.55), and FWHM = FSR/ Finesse.
Some easy checks:
- A difference between FWHM L and FWHM R could give some indication of etalon non uniformity, or wrong setup (poor lens quality).
- The column "calculated center" should display about the same value, otherwise there is something wrong with the measurements.
- The first column "delta cos 2" (0.00260, etc.) should give pretty similar results, otherwise there is something wrong with the measurements.
- The second column "delta cos 2" (0.0000146, 0.0000148, etc.) is very sensible to the accuracy of focus and optical quality of the lens. If some data appear not accurate enough, they could be excluded from the calculation of the average FWHMA.
4) Area of the etalon sampled
The area sampled (i.e. mesured) on the etalon is set
by the diameter of the aperture stop of the
camera lens (and also by vigneting due to the
etalon barrel and lens comnination). For example, a 85 mm f/1.8 lens samples an area
of (approximately) 46.1 mm in diameter on the etalon, while the same lens at f/8 sample an area less than 10.6 mm.
- An easy way to understand this is as follows :
- The fringes system is at the infinite.
- The size of each fringe on the camera sensor depends on its angular diameter and on the focal length of the lens (just like the size of any celestial object).
- The light beam coming from any point of a given fringe is a collimated beam intercepting the whole surface of the etalon (except vigneting due to the etalon barrel).
- Accordingly, the size of the area sampled on the etalon is deterrmined by the size of the aperture stop of the camera lens (to some approximation, see bottom of the page).
- In a perfect world, and in order to sample the whole surface of the etalon in a single shot and estimate the average FWHM and FSR over the full aperture of the etalon, we should use a lens whose aperture is similar to the aperture of the etalon. This is an issue since usually lens have a poorer optical quality at full aperture.
- Otherwise, measurements made with a lens with a small aperture should be integrated properly over the whole aperture of the etalon.
- The farther the camera (or the eye) from the etalon the lower the number of fringes is seen (the angular diameter of the fringes is unchanged, while the angular diameter of the etalon and central spacer decreases). This does not change thes size of the area sampled on the etalon.
Local or integrated FWHM: what is the most relevant?
The FWHM and CWL of a filter vary locallly depending on the area sampled on the etalon.
(a) If the etalon is placed in front position in front of the aperture of the telescope:
- All parts of the etalon contribute equally to the quality (i.e. contrast) of the image. Accordingly, the relevant value to qualify the etalon performence is the FWHM (and CWL) integrated over the full aperture of the etalon, and not the local values of FWHM and CWL.
- However, the mapping of the local values of FWHM and CWL can still be used to calculate the average (or integrated) values over the full aperture of the etalon. The integration of the FWHM of the full aperture of the etalon is correct only if it takes in consideration both the local values of FWHM and CWL.
- For example, let's assume an etalon with local values of FWHM all equal to 0.3 A, but whose CWL changes dramatically of +/1 A for one area sampled to the other. If we compute the average FWHM over the full aperture of the etalon only from the local FWHM value statistic, then the result (0.3 A) is wrong, because of the strong variation of CWL over the aperture. Indeed, a correct calculation should taken into account both FWHM and CWL statistics.
(b) For an etalon placed in rear position:
- Let's assume an observation of the Sun with a 2 m focal length telescope. The diameter of the solar disk at the focal plane is about 2 cm.
- All the area of the etalon within this central 2 cm diameter contribute equally to the contrast of the image.
- Accordingly, ther relevant value for the observation is again the average (or integrated) values of FWHM and CWL, and not the local ones.
More on the size of area sampled and camera lens vigneting effect :
These ray-tracing for Nikon 50 mm f/1.8 are from : https://www.photonstophotos.net
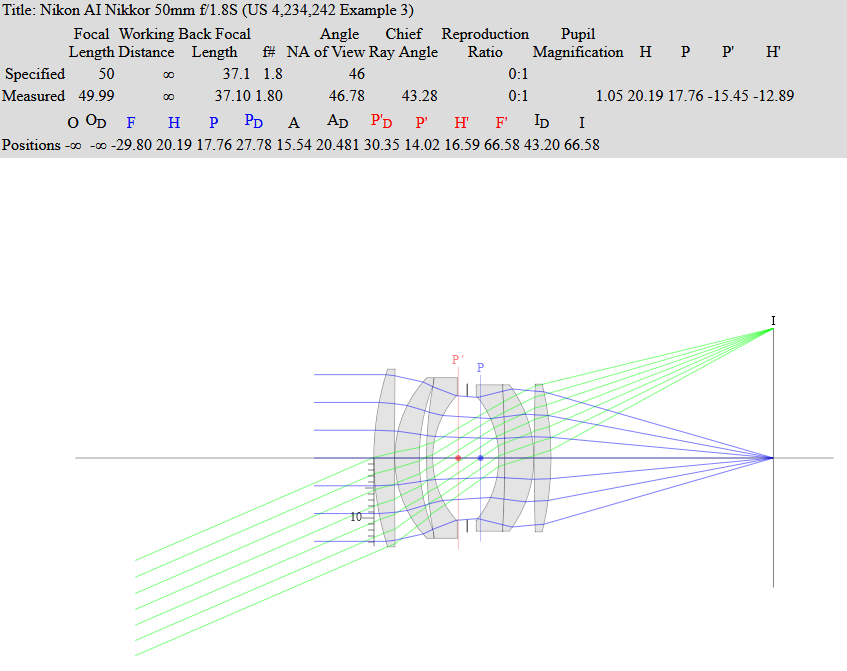
Nikon 50 mm f/1.8 at f/1.8 - The entrance pupil (Pd in blue) is 27.78 mm.
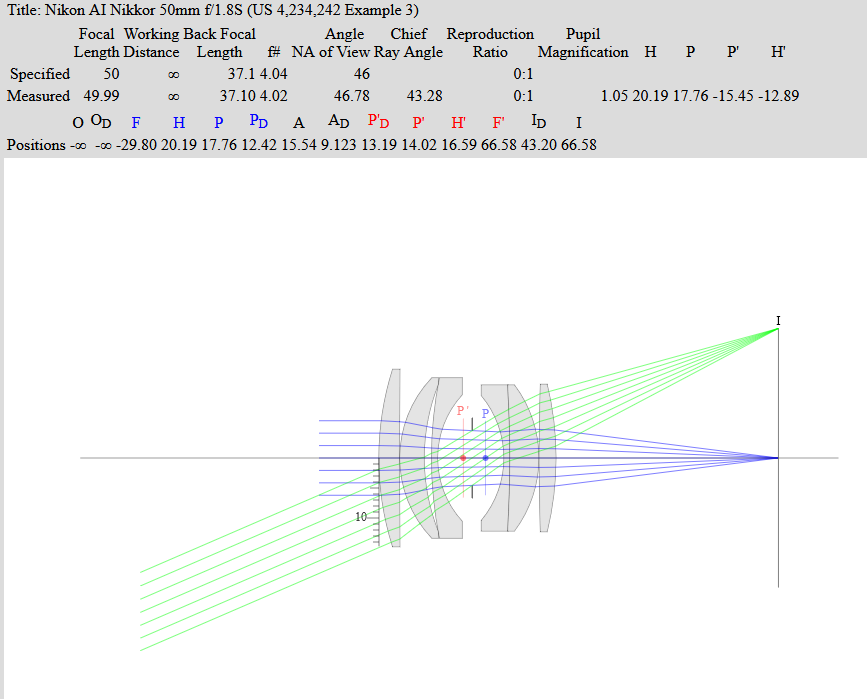
Nikon 50 mm f/1.8 at f/4 - The entrance pupil (Pd in blue) is 12.42 mm.