Spectrographic Sun chromosphere
observations
at Pic Du Midi "Lunette Jean Rösch" with the eShel
spectrograph
July 2009
Jean-Pierre
Rozelot, Valérie Desnoux, Christian Buil
|
|
|
|
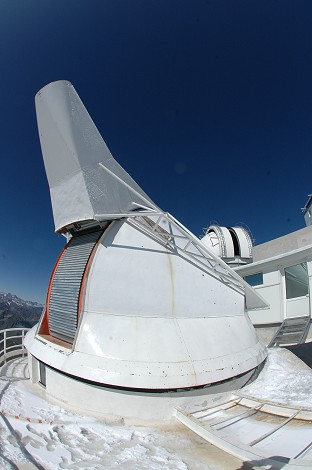
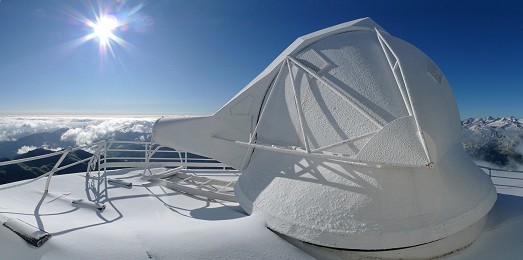
The Jean Rösch
refractor atop Pic du Midi Observatory |
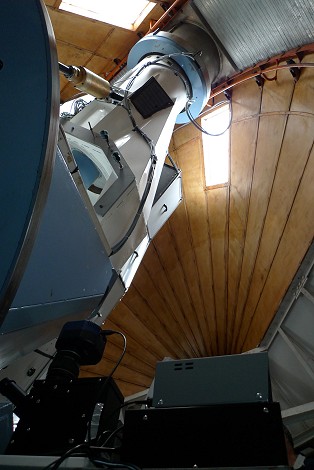
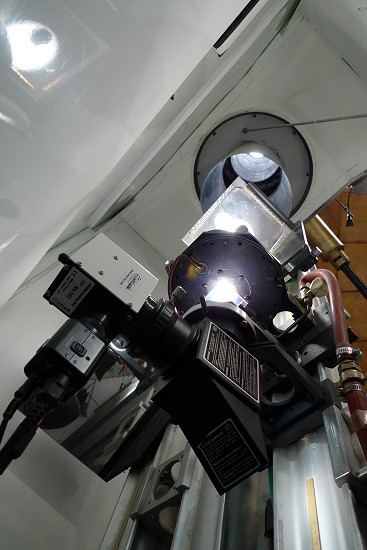
The very peculiar
dome interior of LJR instrument. |
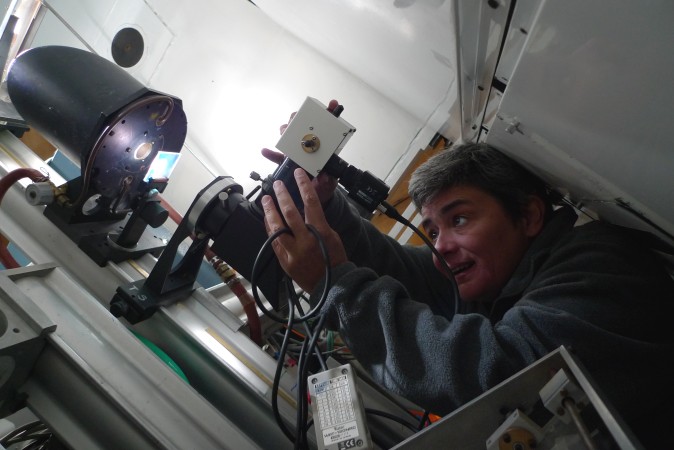
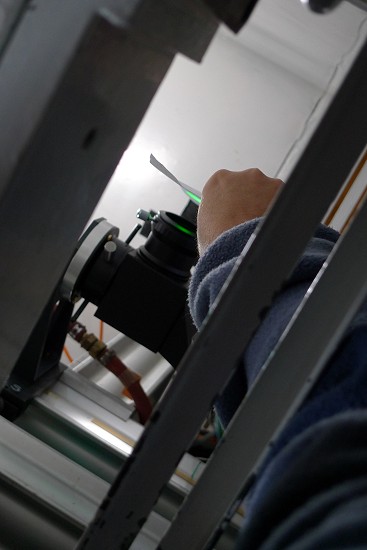
Valérie
Desnoux adjust the position of eShel fiber interface. A Baader Herschel helioscope
reduce the sun flux.
|
|
|
|
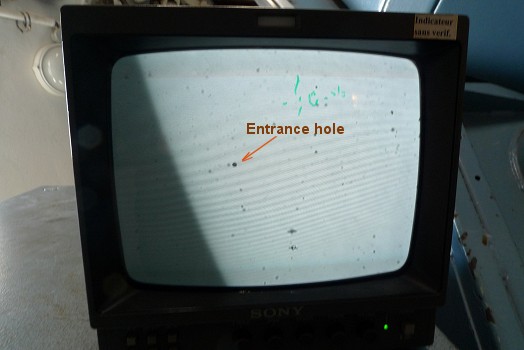
Video image (Watek 120 N camera) of Sun taken with eShel interface. Note the size of the sun image (only a very small part can be see here), and the size of optical fiber hole (diameter: 50 microns, 1.6 arcsec on the sky). |
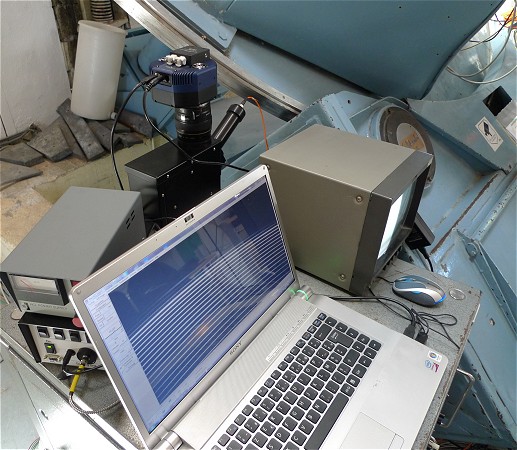
The acquisition computer. Note the echelle spectrum on the screen. |
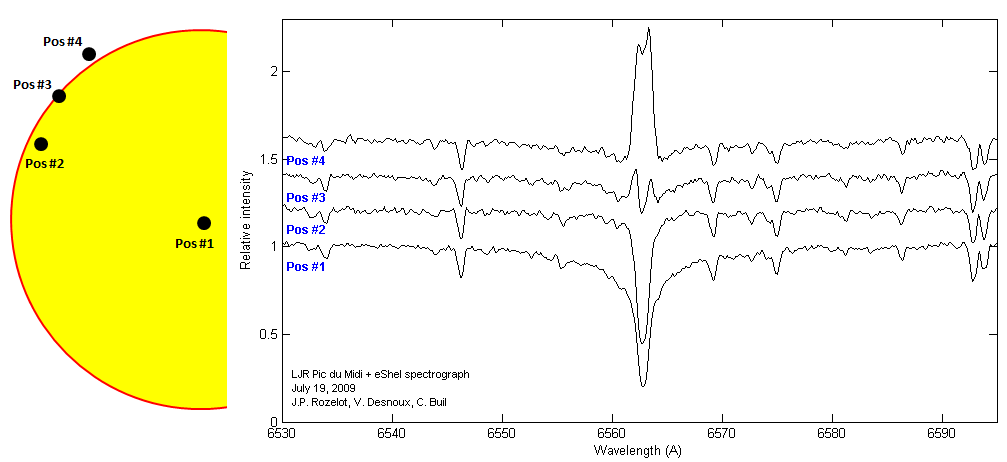
The
important image! The
aspect of Ha
line is function of fiber position on sun surface. The hydrogen
emission contrast
increase near the disk limb. The line profile is inverted
at chromosphere level (from absorption to emission). The Pos #1 sounding point
correspond to geometric
sun center. The Pos #4 sounding is outside the sun disk (the presence of photospheric
absorption lines is the consequence of atmopsheric diffusion
- thin cirrus cloud are presents in the sky).
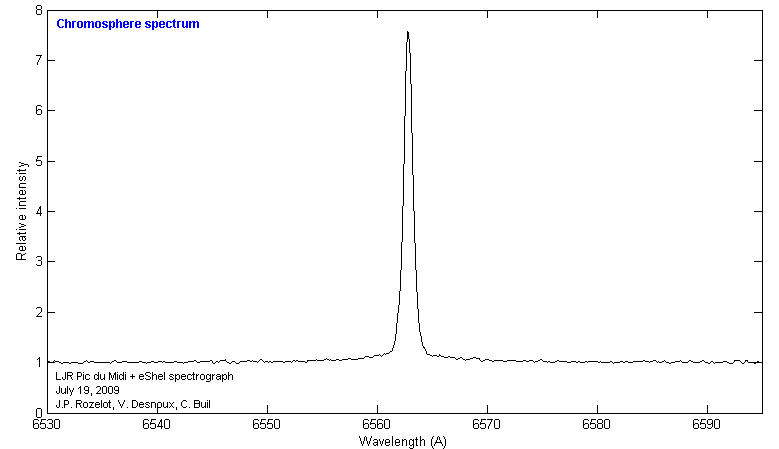
The
ratio of spectra taken at Pos #4 (outside the sun limb) and Pos #1 (disk center).
The operation erase the photospheric
lines and now, a pure chromospheric
emission spectrum car be observed. Here the Ha region.
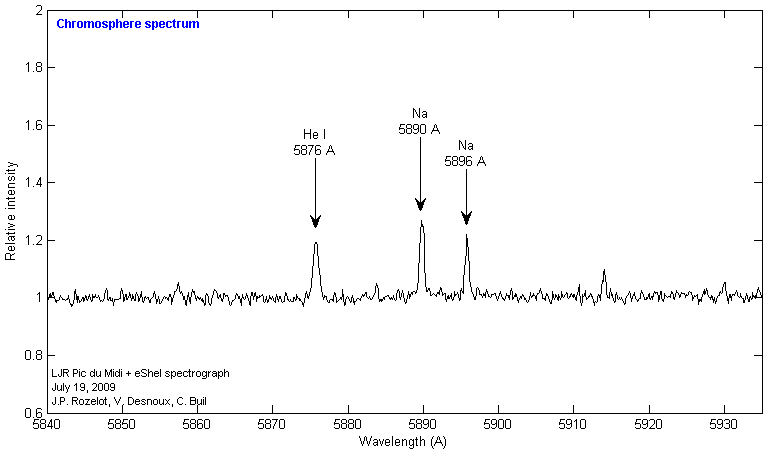
Same
operation (Pos #4 / Pos #1) for the sodium doublet region (D1 & D2). Note
also the presence of 587A He I line (D3 line).
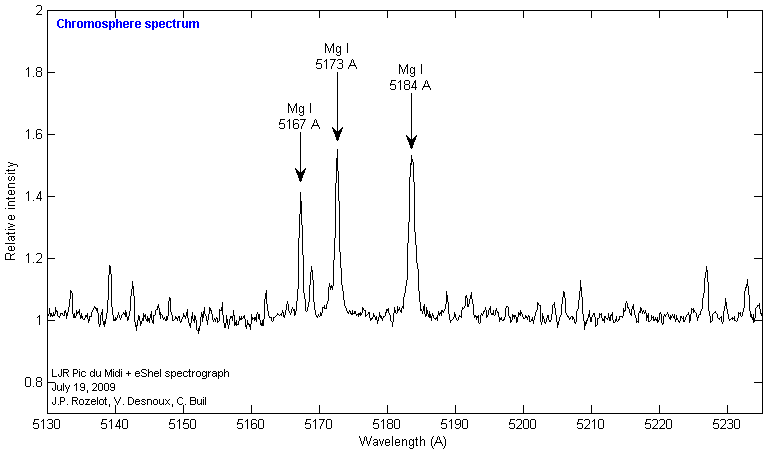
Chromosphere
spectrum in the vicinity of green magnesium triplet. Note also the presence
of many faint emission lines.
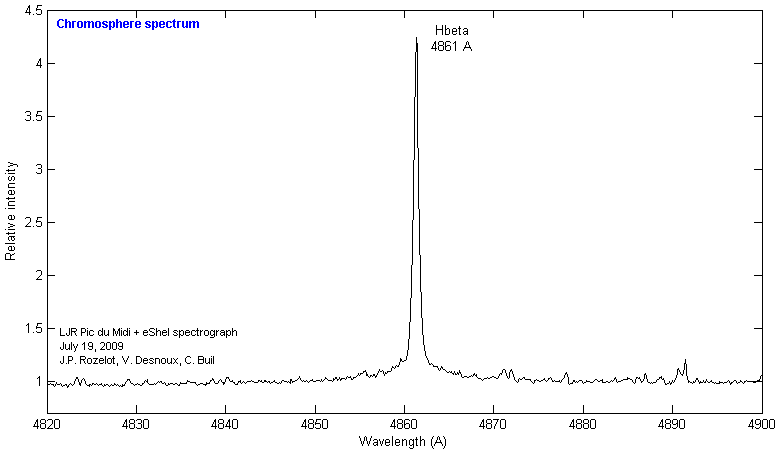
The
Hb
emission.
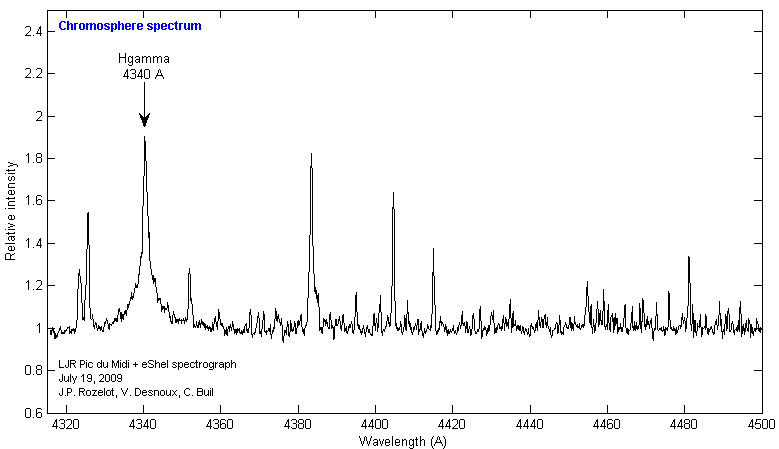
The
violet region is rich of many chromspheric emission lines.
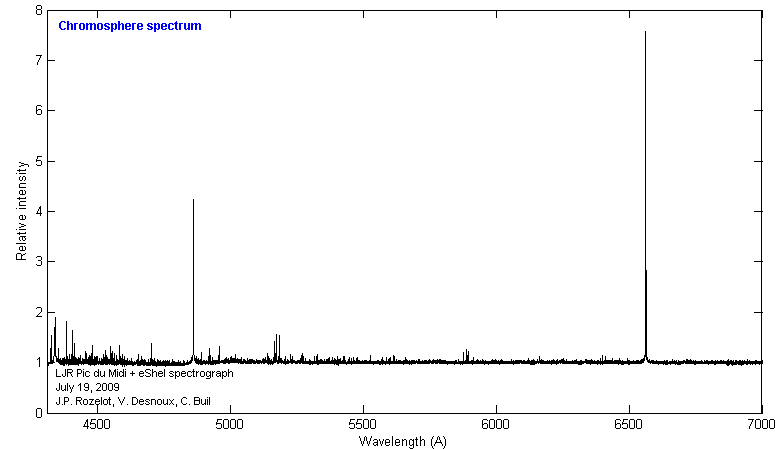
The
global echelle spectrum of sun chromosphere (Pos #4).
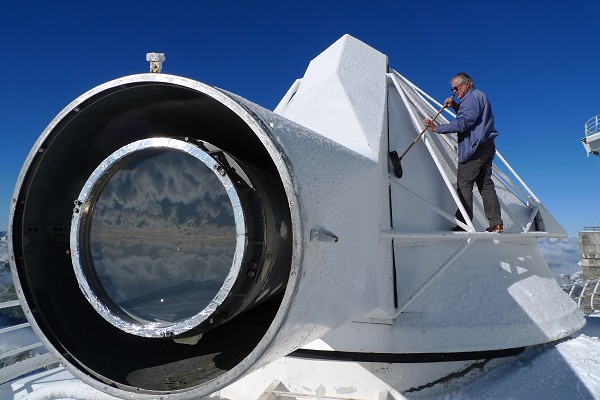
The 50 cm diameter lens of LJR refractor (6.5 meters focal length). Photo V. Desnoux.
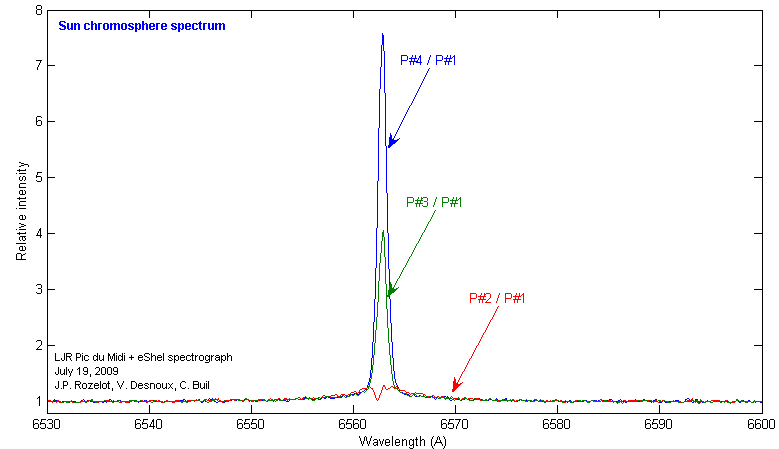
Comparison
of chromosphere spectra for sounding points #2, #3, #4 (relative to #1). Ha
region.
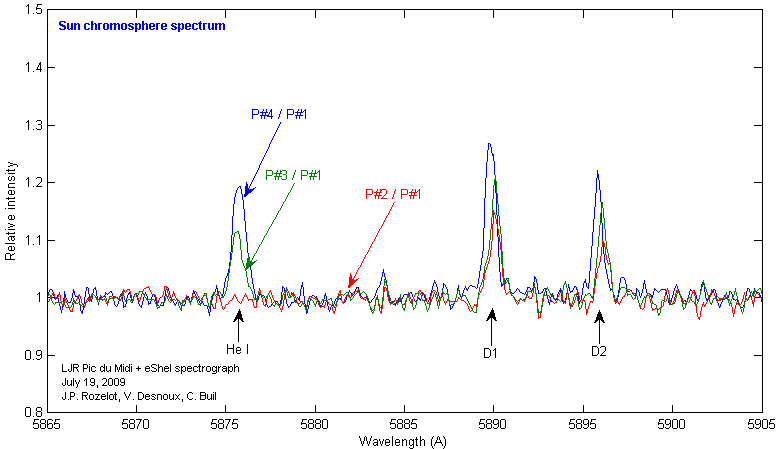
Same
for D1, D2 and D3 region. The disk intensity of He I line is very weak (red
profile).
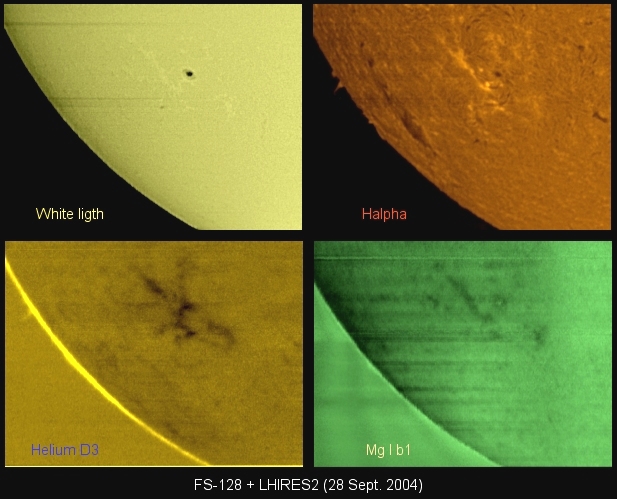
The
large intensity of helium D3 line inversion at the limb interface is confirmed
in these
spectroheliogram, comparative to Ha
or Mg lines (Lhires II spectrograph acquisition, click
here for details).
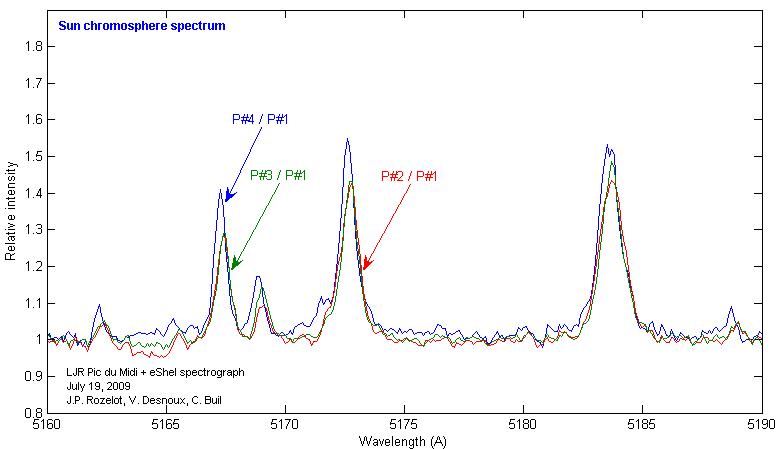
Comparison
of Mg b1, b2 and b3 lines intensity as function of radial position of the optical
fiber.
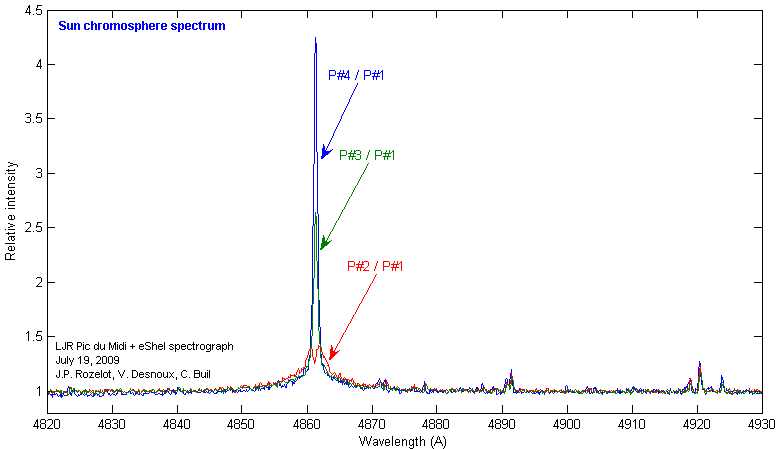
Hb
comparative intensity (very similar to Ha).
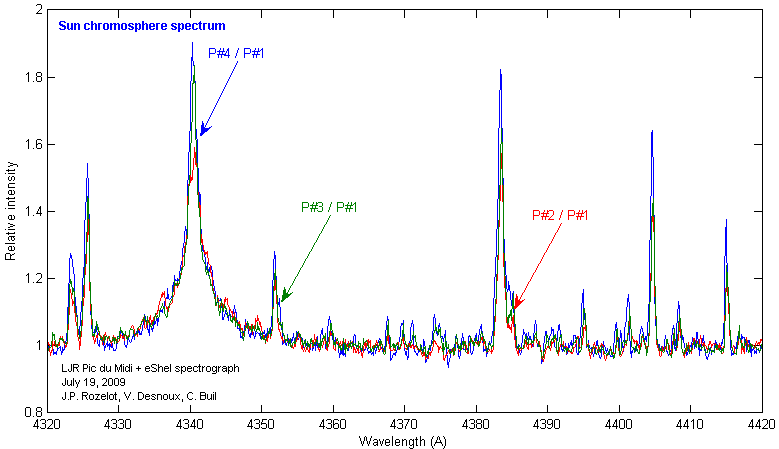
The
violet part of chromosphere spectrum.
Download here the P#2/P#1,
P#3/P#1 and P#4/P#1 spectra.
|
|
|
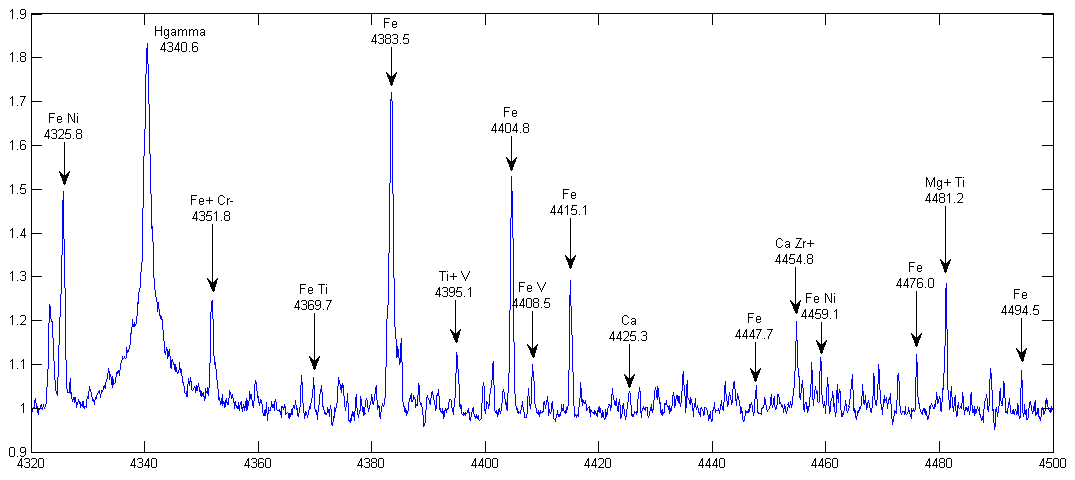
Lines
identification example. The spectrum is equivalent to a flash spectrum observerd
during total solar eclipses.
A very good reference for lines indentification
is S. A. Mitchell, ApJ, 71, 1-61, 1930 (available from ADS).