INFRARED OBSERVATIONS WITH
LHIRES III![]()
Version
en français
ANALYZE DAYLIGHT
We presents some images of 2D spectra of the sun light (daylight in cloudy weather) in the infrared domain. Spectrograph LHIRES III is simply held with the hand (entrance slit directed towards the sky). The grating used is the 1200 lines/mm.
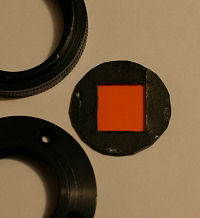
The camera is a Digital SLR Canon EOS 350D with the internal infrared cutoff filter removed. There is no replacement filter. The good news is that for wavelengths longer than 7800 angströms, the colored pigments constituting Bayer RGB matrix (array of Red, Green and Blue pixels) become gradually transparent. For these long wavelength, the CMOS detector of the Canon DSLR is very equivalent to black and white CCD! See here the adaptation of a DSLR on spectrograph LHIRES III. A fred-orange color filter (OG590) is placed just in front of the camera. This filter known as "an order filter" for remove the blue part of the order-2 spectrum superimposed on the order-1 infrared spectrum.
The high pass filter.
The spectra are 30 seconds exposure at 400 ISO. The only processing applied is the thermal signal removal (applied on fRAW files of course). The colors development is made under the Iris software (see examples here). The balance of the colors is not adjusted. The spectral dispersion is approximately 0.226 A/pixel. The spectra in the representations below were reduced by a factor 2 for improve visualization.
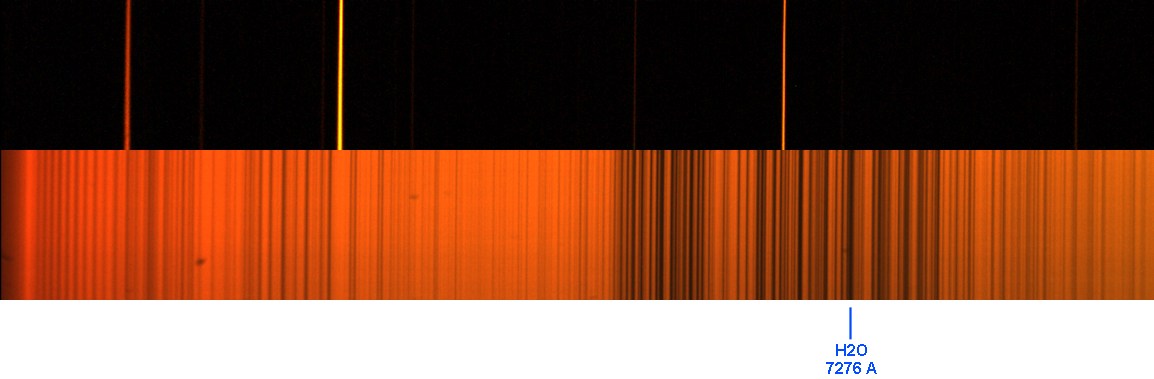
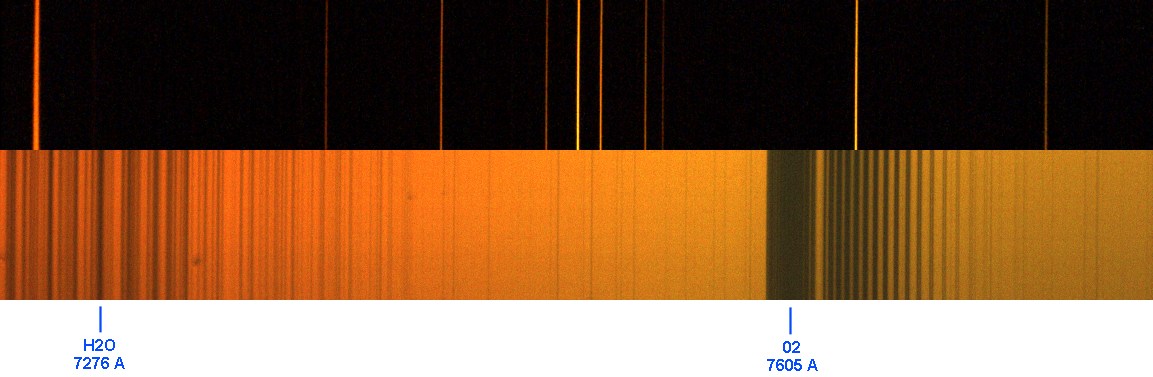
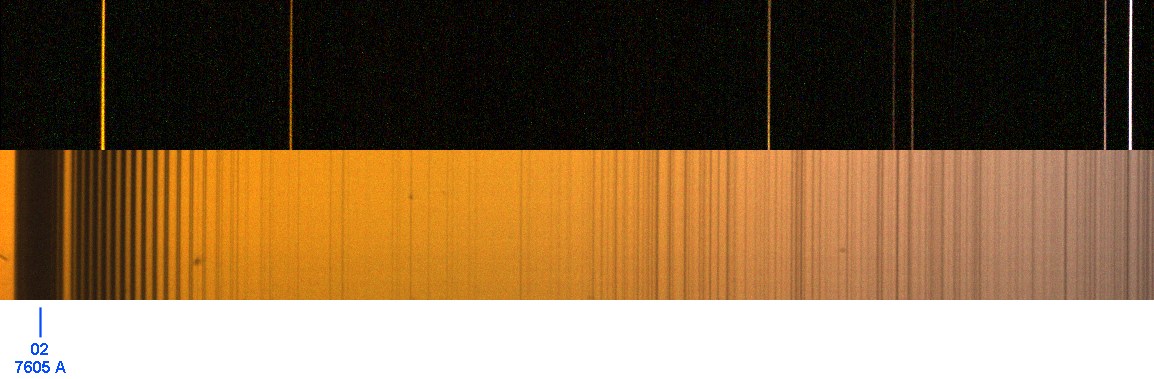
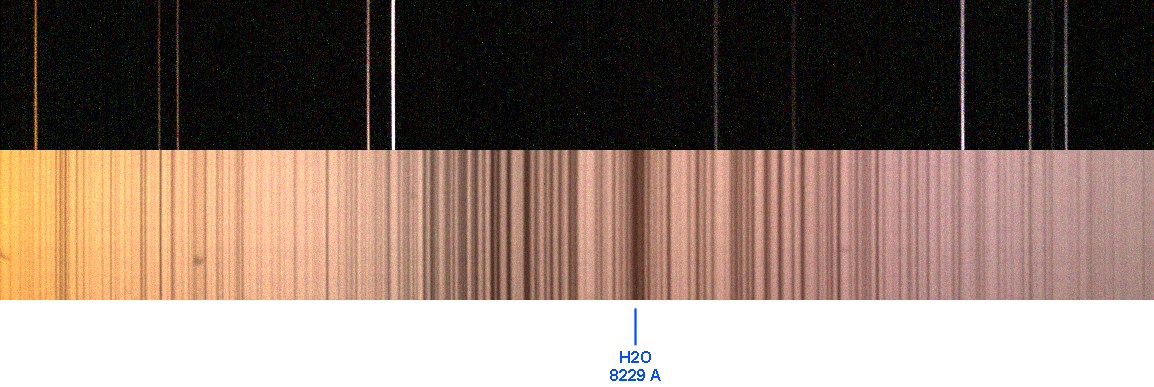
For each images, there is in top the neon spectrum (internal calibration lamp of LHIRES III) and in bottom the Sun spectrum.
The increasingly neutral colors is clearly evident in the following table:
|
Relative responsivity @ 7000 A |
Relative responsivity @ 8600 A | |
|
"red" pixels |
1.00 |
1.00 |
|
"green" pixels |
0.40 |
0.84 |
|
" blue" pixels |
0.05 |
0.77 |
The far infrared is not strictly neutral after filter removal, but it is reasonably possible to add without interpolation RGB channels to build a black & white high resolution image, very equivalent to that which one would obtain with a standard CCD camera.
|
|
|
The next images are realized under the same conditions as those described before, but for longer wavelengths (up to 950 nm). Towards 900 nm and beyond, the spectrum is largely dominated by the Earth atmosphere H2O bands. In these images, the upper spectrum corresponds to the internal neon lamp light of LHIRES III spectrograph, the central spectrum is the solar light (spectrograph directed towards a cloudy sky), the lower tape is the from the light of a fluorescent lamp (low consumption Osram Dulux Superstar model).
Some lamps "low-consumption "
lamp.
Fluorescence comes from a special deposit on the
internal face of the lamp.
Fluorescence is induced by the presence of intense
emission lines of vapor of mercury.
The most intense
lines mercury lines are located in the ultraviolet, but
some of them can be
seen in the visible spectrum with our camera.
In the infrared,
these lamps give a beautiful spectrum of argon (impurity gaz ?).
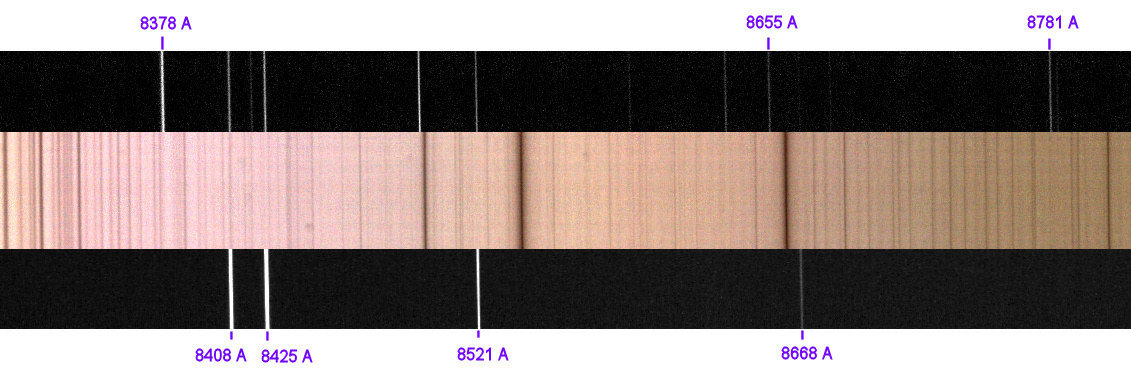
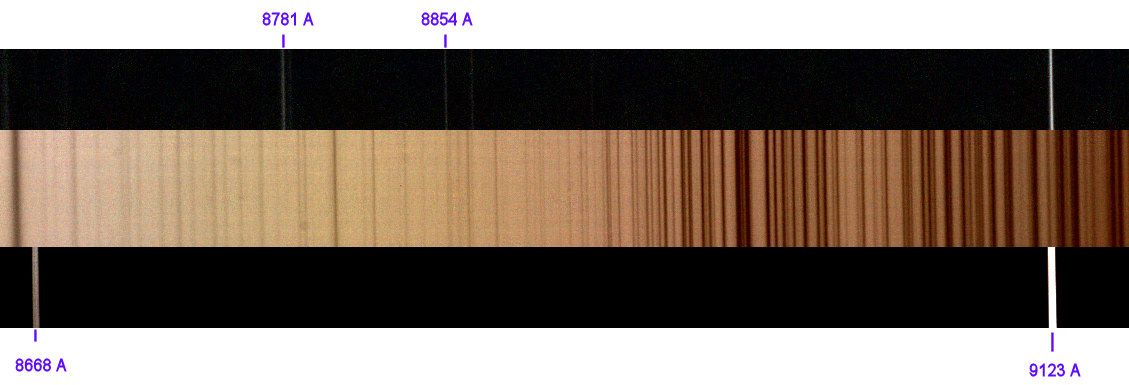
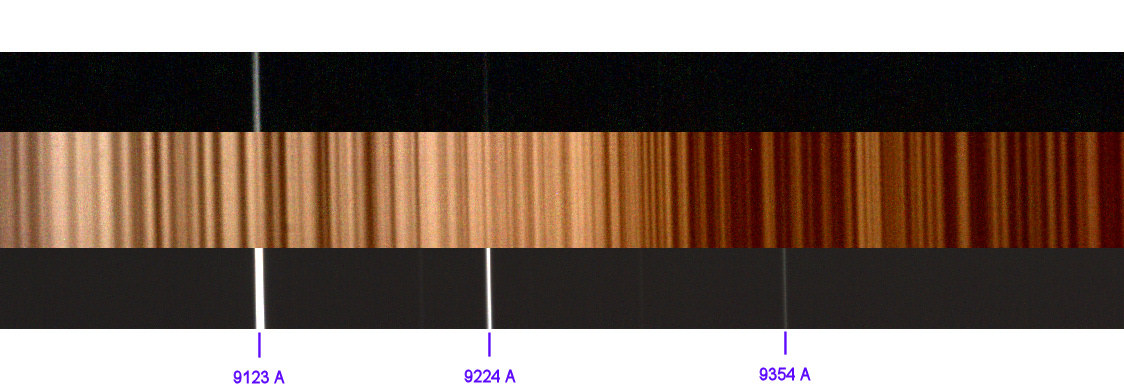
Where is some coincidences in position between the lines of neon lamp and fluorescent lamp (calibration neon lamp contains some traces of argon). The lines of neon and argon are omnipresent for a precise spectral calibration?
The solar spectrum is very clean. It is a beautiful performance of LHIRES III with a large-public camera. It opens prospects, because to extend the spectral range of a spectrograph is equivalent increasing the diameter of a telescope!
AT THE OTHER
END...
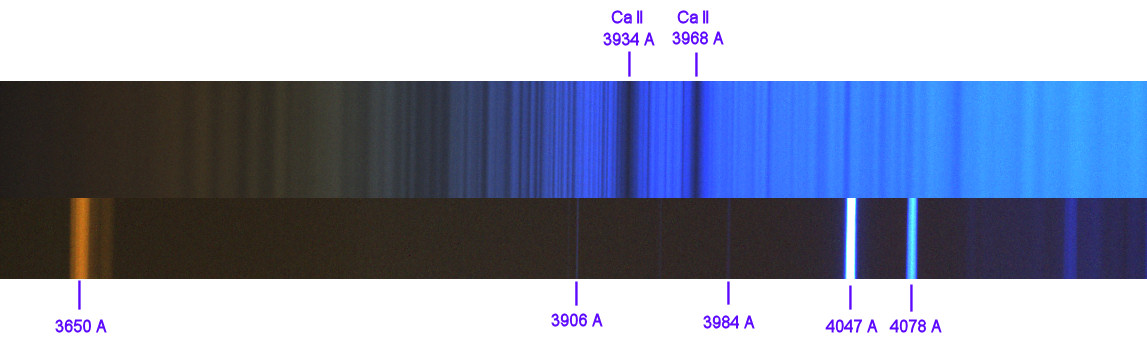
THE ULTRAVIOLET SPECTRUM WITH A DIGITAL SLR CAMERA
Towards 3800 A, the filters of the Bayer matrix become transparent. It is the same phenomenon as in the infra-red. But the sensitivity of CMOS sensor of the 350D falls well quickly in the ultraviolet regkion. However, H and K lines of ionized Calcium are accessible. This interesting performance is not possible that with an unmodified camera (original Canon filters cuts not only the deep red, but also the extreme blue).
OBSERVATION OF STELLAR OBJECTS
This part shows the infrared spectrum of some brilliant stars realized with spectrograph LHIRES III (equipped with the 1200 traits/mm grating) associated with a simple unfiltered Canon EOS 350D (see higher). The telescope is Celestron 11 (D=0.28 m).
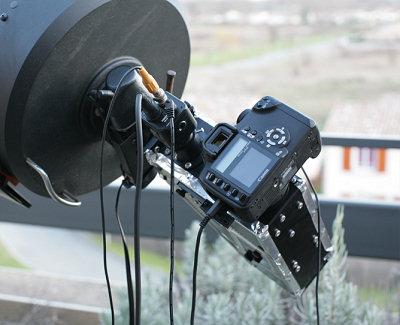
The LHIRES III
and numerical camera.
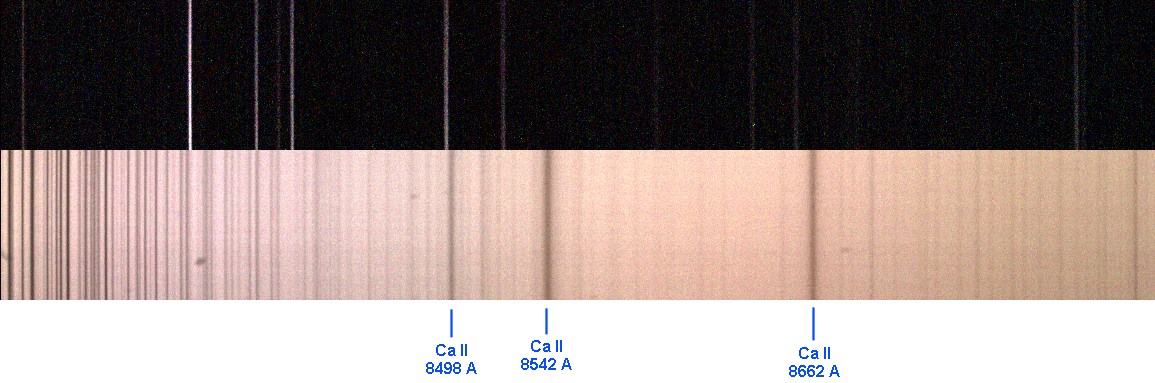
The selected area of the spectrum contain the infrared triplet of ionized calcium. The interest of the choice:
- the presence of the calcium lines, but also the beginning of the Pashen sequence of hydrogen (the infrared equivalent of the Balmer series of in the visible spectrum, which ends with the famous Ha line),
- an atmospheric window, quasi free from telluric water vapor lines,
- the presence of many emission lines produced by the internal lamp of LHIRES III for a simple and precise spectral calibration,
- one seen it, the CMOS of the Canon detector become a black and white sensor in this part of the spectrum.
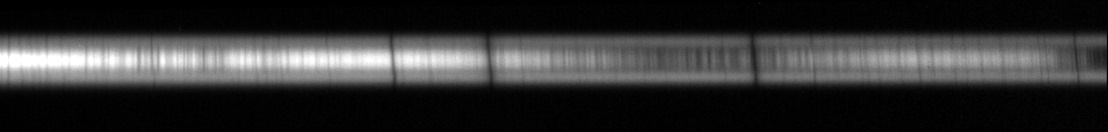
Here the two dimensions (2D) spectrum of the Betelgeuse star is presented with a 100% scale (a portion only, centered on the calcium triplet):

Portion of the
2D spectrum of Betelgeuse (exposure 3 x 120 seconds).
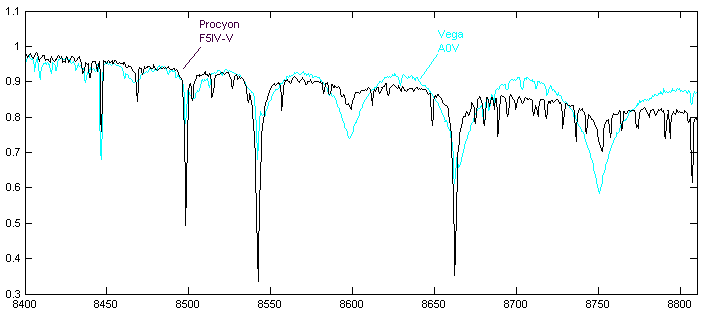
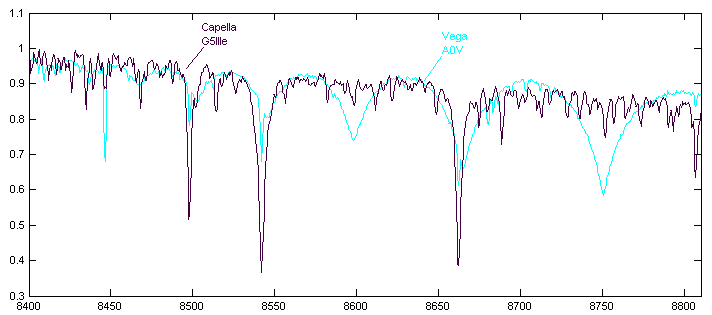
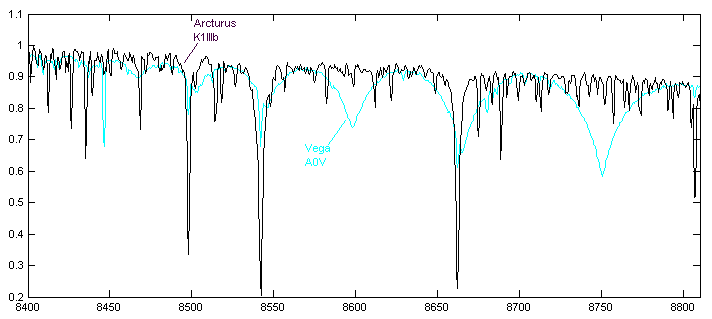
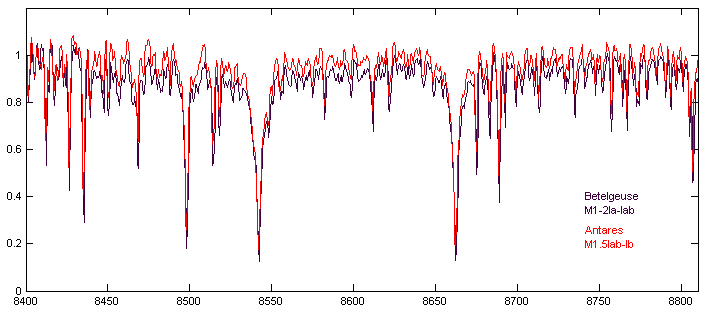
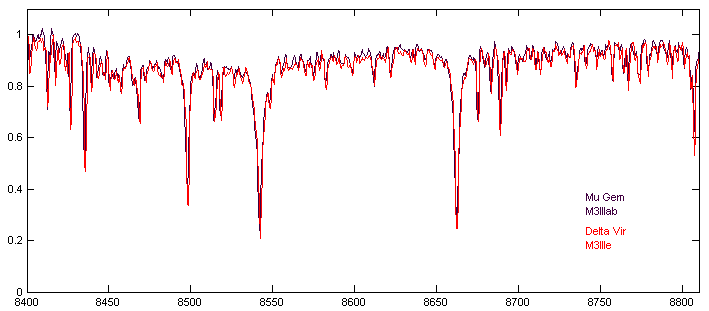
The figure below shows a sequence of stars spectra with very diverse spectral type, obtained the February 14 and 15, 2007. The exposure times characteristic is 3 to 6 x 300 seconds (except for Betelgeuse, which is a red object very shining).
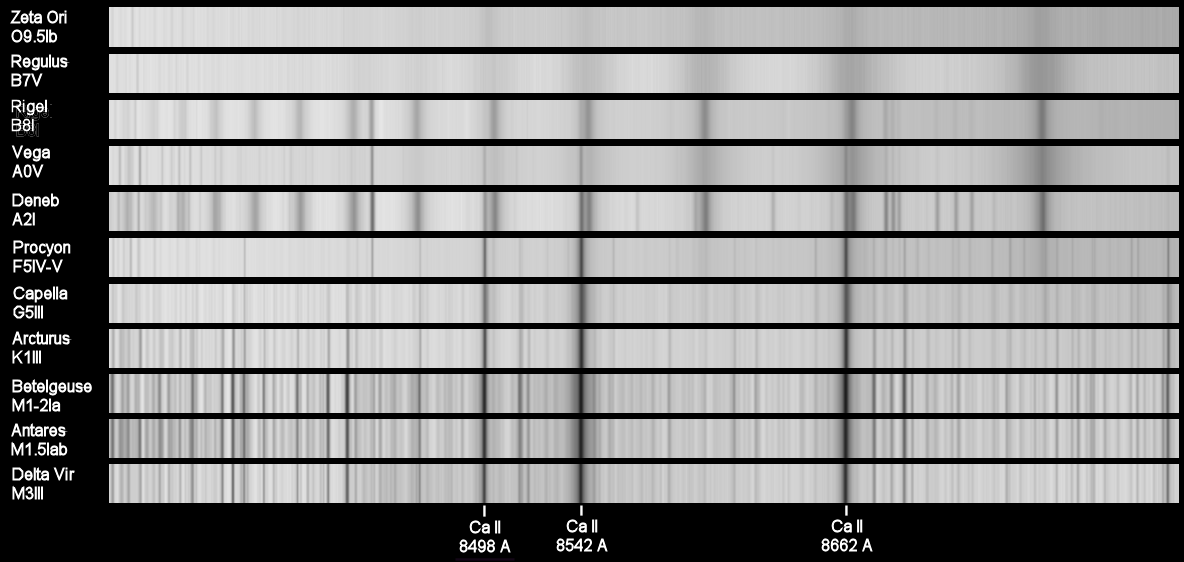
Séquence of
spectra in the near the magnesium triplet. The temperature of the objects
drops while going from the top downwards.
Click on the image to
display an enlarged view of this document.
The recorded spectra proved a high quality, in spite of the use of a at the very least common and economic camera. The processing of the spectra is nearly identical to that done with a specialized CCD camera. Spectro-photometric quality is excellent. For example, by carrying out a flat-field in the pipeline processing, it is possible extremely well to correct the fringes phenomena, as shows it the following spectral profiles:
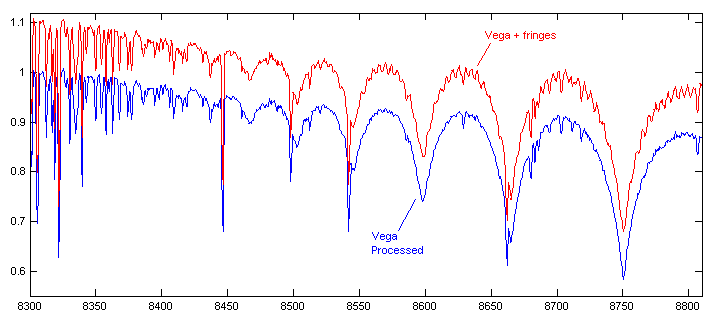
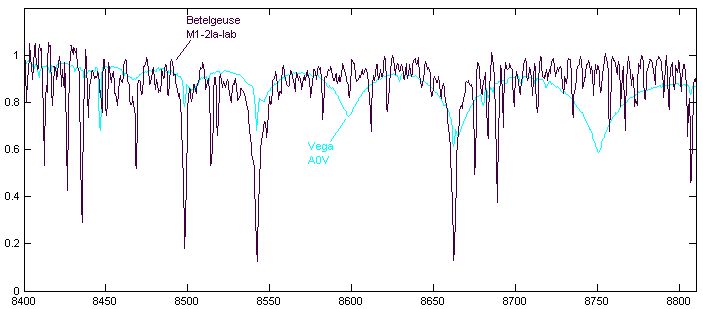
The spectrum of the
Vega (Alpha Lyr) in all the acquired spectral range. The fringes which
modulate the intensity
RAW spectra can be withdrawn during the pre-processing
(division by the " flat field"). Fine and very many lines
in the left part
are the telluric lines of H2O (water vapor of our own atmosphere).
The
Pashen sequence of hydrogen is quite visible (intensity is increasing while going towards the red).
CaII is already
quite visible in the spectrum of Vega (rays much finer than those of
hydrogen).
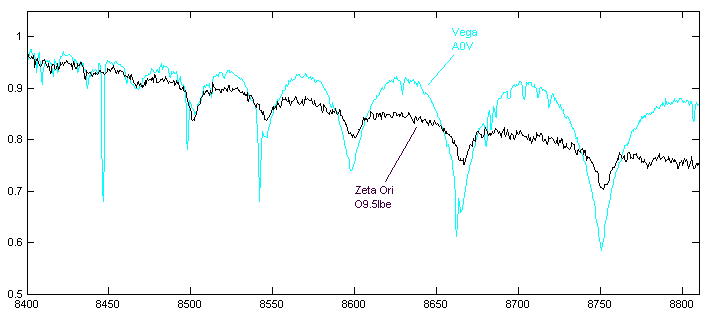
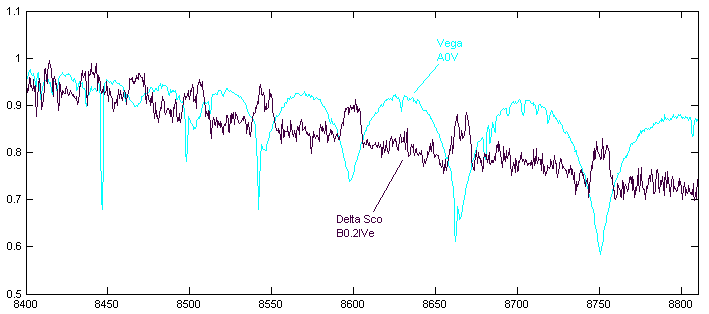
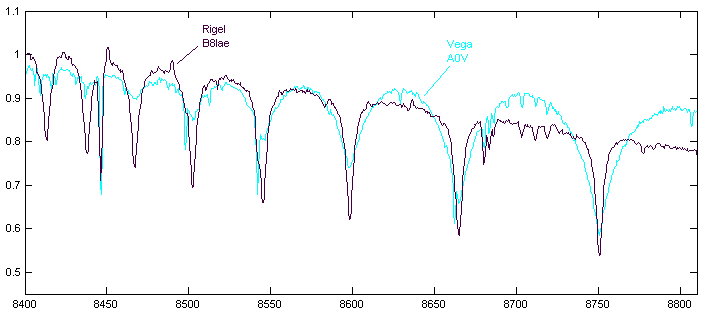
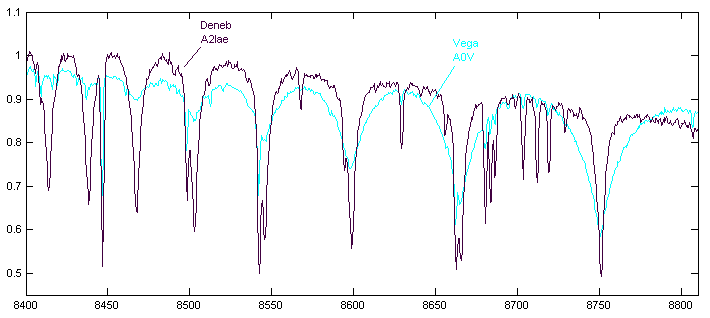
The graphs below shows some characteristic spectral profiles acquired with this equipment (the February 14 and 15, 2007)(with often comparison with the spectrum of the Vega star. The radial velocity of stars is corrected (source SIMBAD) as well as heliocentric speed at the time of the observation (HELIO commmande of Iris). For example for the Vega star the radial correction speed is +0.39 A and the heliocentric correction is +0.27 A, that is to say a total of +0.66 A.
Some note:
- the lines hydrogen lines appear in emission in the spectrum of the Delta Sco, which one points out that it is about a member of the "Be" family. The form f emission is very different according to the line considered.
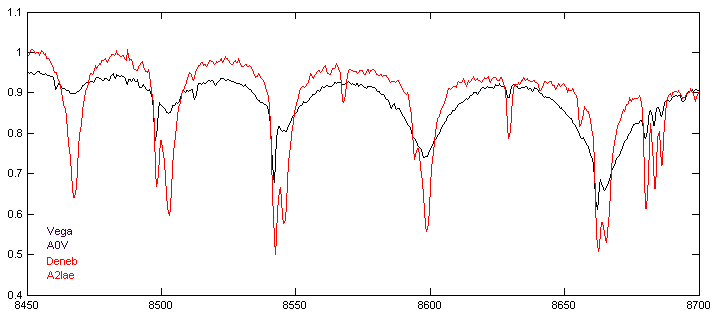
- In the Deneb star the lines of hydrogen and ionized calcium have an equivalent intensity, which gives the feeling of duplicity and the strange character of this spectrum.
- the star Zeta Orion is relatively brilliant and yet its spectrum appears disturbed. In fact, this object is so hot and blue, that it sending only a very modest signal in the analyzed infrared part of the spectrum. This explains that.
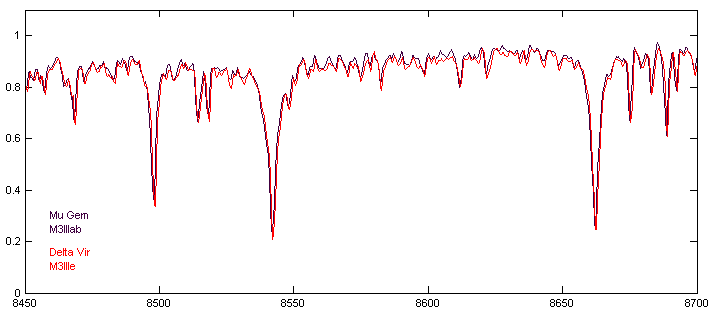
- the resemblance of the spectra of Mu Gem and Delta Vir. It is normal since the spectral types are identical. But it is wise to underline the very good consistency of the data obtained by the chain of acquisition and processing (here Iris for the preprocessing and VisualSpec for the calibrations).
To finish this description of the capacities of infrared observations with LHIRES III, here a small part of planet Saturn spectrum in the vicinity of the Calcium triplet (stack of 3 X 300 seconds with the modified 350D). The conditions were bad (wind and turbulence) so that the space resolution is modest. The spectra in top and bottom however show the spectrum of the rings:
The spectrum is complex. One sees the lines of the solar spectrum inclined by the rotation of the planet (Doppler effect), the nontilted lines only present on the disc which are specific to the Saturn atmosphere, broad absorption (due to methane probably) which affects the intensity of the disc but not that of the rings.