5-inch refractor + R=1000 spectrograph
24-inch reflector + R=540
spectrograph (Rondi conception)
8-inch reflector + R=7000 spectrograph
NOVA SAGITTARII 2002 N°3 (V4743 Sgr)
Spectroscopic observations of the nova Sagittarii
2002 N°3.
V4743 Sgr was discovered by Katsumi Haseda, Aichi, Japan on Tri-X film taken
with a 120-mm f/3.5 camera lens on Sept. 20.431 UT (V=5.5) (IAUC7975). Localization
of the nova (2000.0): RA = 19h01m09.3s - DEC = -22°00'05"
Journal of the observations and instrumentation
Date (UT) |
Observatory |
Telescope |
Resolution @ 6563 A |
Dispersion |
CCD |
Observer(s) |
Castanet |
CN-212 Takahashi |
R=7000 |
0.38 A/pixel |
Audine - KAF-1602E |
C. Buil |
|
22.853 / 09 / 2002 |
Castanet |
CN-212 Takahashi |
R=7000 |
0.38 A/pixel |
Audine - KAF-1602E |
C. Buil |
24.840 / 09 / 2002 |
Castanet |
CN-212 Takahashi |
R=7000 |
0.38 A/pixel |
Audine - KAF-1602E |
C. Buil |
25.832 / 09 / 2002 |
Castanet |
CN-212 Takahashi |
R=7000 |
0.38 A/pixel |
Audine - KAF-1602E |
C. Buil |
26.806 / 09 / 2002 |
Castanet |
CN-212 Takahashi |
R=7000 |
0.38 A/pixel |
Audine - KAF-1602E |
C. Buil |
Castanet |
FS-128 Takahashi |
R=1000 |
2.86 A/pixel |
Audine - KAF-0401E |
C. Buil |
|
Castanet |
FS-128 Takahashi (5-inch refractor) |
R=1000 |
2.86 A/pixel |
Audine - KAF-0401E |
C. Buil |
|
29.852 / 09 / 2002 |
Castanet |
CN-212 Takahashi |
R=7000 |
0.38 A/pixel |
Audine - KAF-1602E |
C. Buil |
30.811 / 09 / 2002 |
Castanet |
CN-212 Takahashi |
R=7000 |
0.38 A/pixel |
Audine - |
C. Buil |
03.832 / 10 / 2002 |
Castanet |
CN-212 Takahashi |
R=7000 |
0.38 A/pixel |
Audine - KAF-1602E |
C. Buil |
04.834 / 10 / 2002 |
Castanet |
CN-212 Takahashi |
R=7000 |
0.38 A/pixel |
Audine - KAF-1602E |
C. Buil |
05.822 / 10 / 2002 |
Castanet |
CN-212 Takahashi |
R=7000 |
0.38 A/pixel |
Audine - KAF-1602E |
C. Buil |
06.811 / 10 / 2002 |
Castanet |
CN-212 Takahashi |
R=7000 |
0.38 A/pixel |
Audine - |
C. Buil |
07.807 / 10 / 2002 |
Castanet |
CN-212 Takahashi |
R=7000 |
0.38 A/pixel |
Audine - KAF-1602E |
C. Buil |
Pic du Midi |
24-inch telescope |
R=540 |
5.80 A/pixel |
Audine - |
A. Rondi, S. Rondi, V. Desnoux, C. Buil |
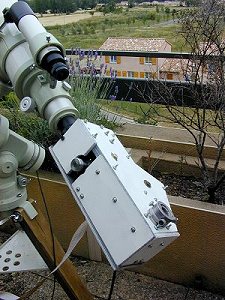
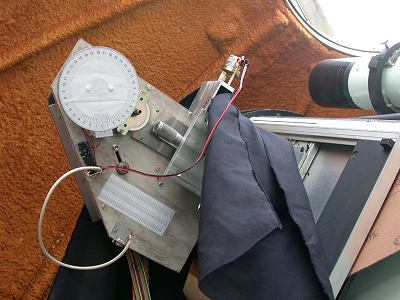
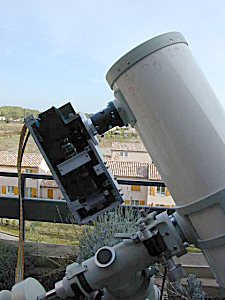
View of the instruments
:
5-inch refractor + R=1000 spectrograph |
24-inch reflector + R=540
spectrograph (Rondi conception) |
8-inch reflector + R=7000 spectrograph |
A
colored 2-D spectrum of V4743 Sgr
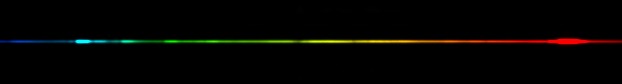
Part of the 2-D spectrum of V4743 Sgr
for the date: September 27.8, 2002 (2.86 angstroms/pixel).
Artificial colors are added (Iris and VisualSpec processing software).
Red domain (H-alpha line): Continuum normalized
for the mean signal between 6400 and 6410 angstroms.
Bleue domain (H-beta line): Continuum normalized for the mean signal between
5230 and 5240 angstroms.
Time resolved observations of
the H-Alpha profile between JD2452540.5 and JD2452556.0, step of 0.5 days (spline
interpolation along wavelength axis and linear interpolation along time axis).
The intensity scale is relative to the continuum level for the instant of the
observation at 6400-6410 A (see the important remark in the Comment section
below for interpretation). Spectral sampling: 0.38 A/pixel.
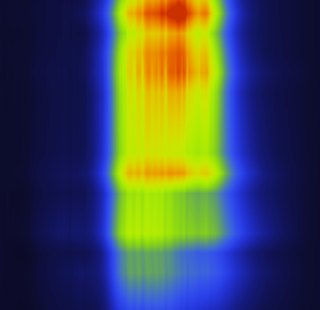
3D dynamical spectrum from
JD2452540.5 to JD2452556.0.
Selection of spectral profile in the
vicinity of H-Alpha line.
Blue region.
Evaluation of the Equivalent Width (EW) of the H-Alpha line for the period September 22.796 - October 8.796 period (click here for a definition of the EW). Continuum is normalized to unity between 6400 and 6410 angstroms . Fast fluctuation are detected (see also dynamic spectrum above), but remark that this EW curve is not necessary representative of the physical (true) variation strength of the emission line because it is referred to the continuum level and because this continuum level change along the time (magnitude variation of the nova). The EW is only indicative of the line strength relative to the continuum level for the instant of the observation. So, global change of the nova brightness can be at the origin of this temporal variation. To get "true" strength it is necessary to relate the observed continuum level to simultaneous good calibrated photometric or spectrophotometric data. It is not the case here.
EW function of the date:
Date
JD-2450000
EW
22.796/09/2002 2540.296
652
24.840/09/2002 2542.340
1141
25.832/09/2002 2543.332 1104
26.806/09/2002 2544.306 1772
27.830/09/2002 2545.330 1376
28.803/09/2002 2546.303 1549
29.806/09/2002 2547.306 2360
30.811/09/2002 2548.311 1847
03.832/10/2002 2551.332 2034
04.834/10/2002 2552.334 2324
05.822/10/2002 2553.322 2227
06.811/10/2002 2554.311 1928
07.807/10/2002 2555.307 2523
08.796/10/2002 2556.296 1940
André & Sylvain Rondi observations (see http://astrosurf.com/rondi/spectro/nova.htm):
26.813/09/2002 2544.313
1566
27.807/09/2002 2545.307 1232
28.789/09/2002 2546.298 1511
29.834/09/2002 2547.334 2178
06.846/10/2002 2554.346 1967
Equivalent Width (EW) of the H-alpha
line (click
here for a definition).
Cross dots are the Rondi's data.
For FWHM & FWZI for the date 29.806 / 09 / 2002 (JD=2452547.306):
FWHM of the H-alpha profile = 2650 km/s
+/- 150 km/s
FWZI of the H-alpha profile = 6400 km/s +/- 300 km/s
Continuum normalized for the mean signal between 6400 and 6410 angstroms. OG590 order filter is used for acquire IR part of the spectra.
4000-6750
A region and 6750-9500 A region. The grey curve is scaled by a factor 10 (click
into the images for enlarge)
Click on the image for enlarge.
Comparison of the September 27.8, 2002 spectrum and the April 24.06, 2003 spectrum. Dramatic changes are visible. The [O III] lines are very intenses in the later spectrum, characteristics of the nebular phase.
Comparison of the H-Alpha line profile for two
spectral resolution (nearly simultaneous observation dates).
September 26.806 UT spectra.
8-inch Newton, sampling of 0.3805 A/pixel (linear dispersion), resolution
(R) of 7300.
September 26.855 UT spectra. 5-inch refractor, sampling of about 2.86 A/pixel (adopted
dispersion law: 9.7949E-6 x lambda2 + 2.8548 x lambda), resolution (R) of 1000.
Comment: Useful information about the H-alpha with a good confidence are accessible using the low resolution spectrograph (FWHM, peak intensity, general shape, etc) and a 5-inch aperture refractor (a good apochromatic refractor given very sharp stellar image and an optimized optical combination for the spectrograph with a negligible seeing effect on the spectral resolution ). Click here for a description. Note: The R=7000 spectrograph is the regular instrument used for my Be-stars survey.
Comparison of a normal star (Gamma Peg) and V4543 Sgr spectral distribution. Gamma Peg is used for extract the instrumental responsivity. Notice the position of the principal telluric absorption lines and the Fraunhofer lines (telluric bands are not removed from nova spectra). The calibration (bias, thermal signal, flat field, wavelength calibration and response curve) was done using usual procedure in Iris and VisualSpec - click here for details).