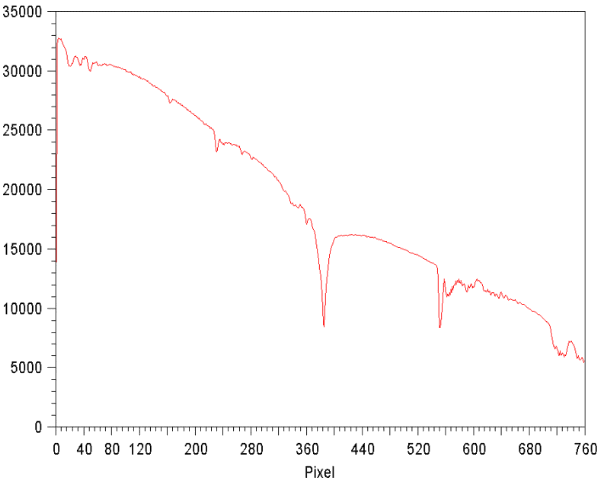
In the following figure (red part of Vega's spectrum), the spectral profile is typical of what is available after extraction. This spectrum has been obtained with a 600 grooves/mm grating for an approximate resolution of R=1500. An important step is to replace pixel numbers by wavelengths along the X axis. This operation is called spectral calibration (i.e. fix the wavelength zero point of the dispersion curve). The line in the center (around pixel # 360) is the H-alpha line. The line in the neighbourhood of pixel number 550 originates in the terrestrial atmosphere (O2). It is in fact a molecular band.
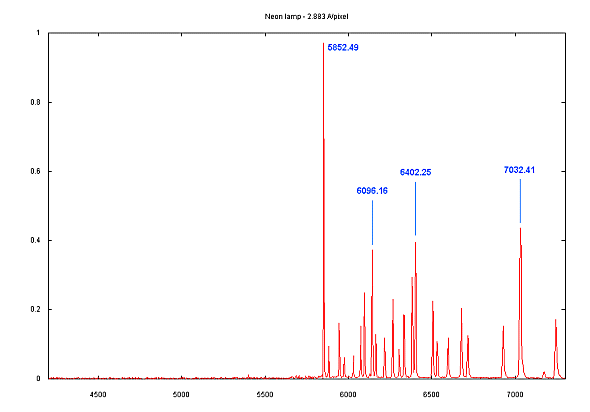
With a classical slit spectrograph, calibration is done by injection through a fine entrance slit (some microns of wide) of light from a lamp containing a gas having emission spectral lines. Since those lines' positions are well known, it becomes possible to link pixels numbers to wavelengths (in first approximation the relation is a linear one). In the following figure, a spectrum from a neon lamp is shown. Such lamps are interesting for our purposes since they can be found for a low price from electrical shops. The neon gaz lamps are typical : they are used as indicators in industrial equipment, and their light is noticeable for its reddish color. The next table list the line position in angstroms for the neon (Ne) :
3417.9035
NeI |
5944.8342
NeI
|
8300.3263
NeI |
Neon Spectral
Line List
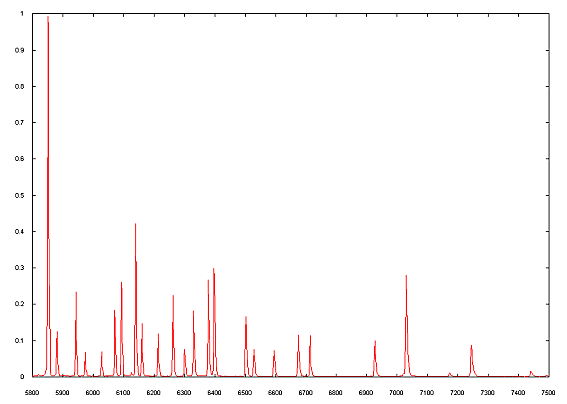
The next graph show an experimental spectrum of a domestic neon lamp (sampling of 1.44 A/pixel). Wavelength are in angstroms. Click here for a description of the spectrograph used.
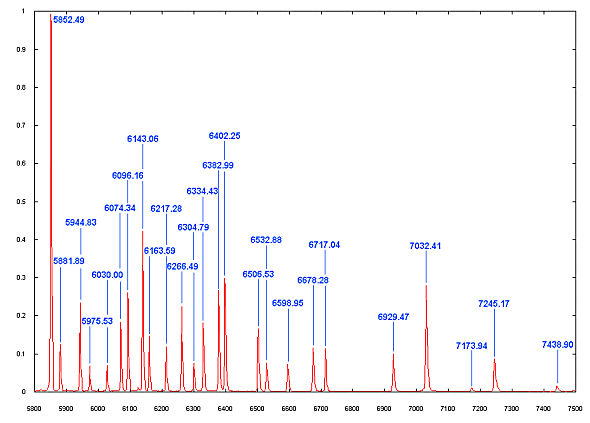
Next graph: a commented version of the neon spectrum. Click on the image for enlarge.
You can also use some domestic lamps for calibration... The light of the suburb sky is also a source of calibration lines ! Some examples (click on the images for enlarge):
The Ne lamp:
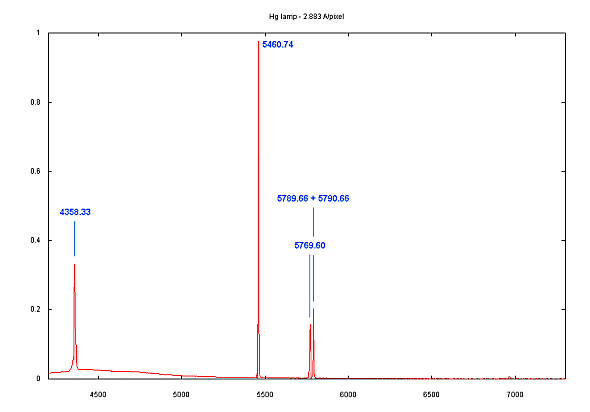
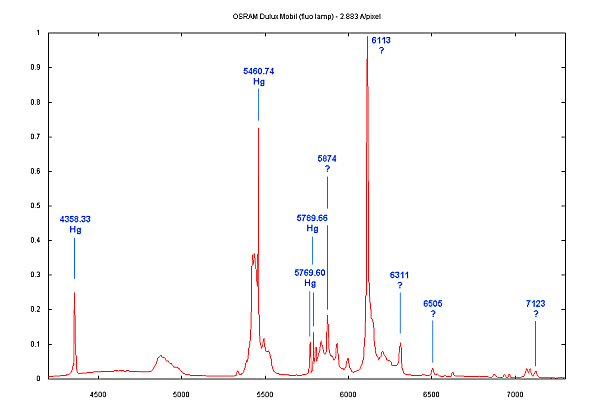
The Hg lamp:
|
Wavelength |
|
3341.48 |
Hg spectral lines list
The Osram Dulux
Mobil lamp (note
the presence of the Mercury - a very economical and useful hand
spectral lamp for this gaz spectral signature - click
here
for a color view of this spectrum):
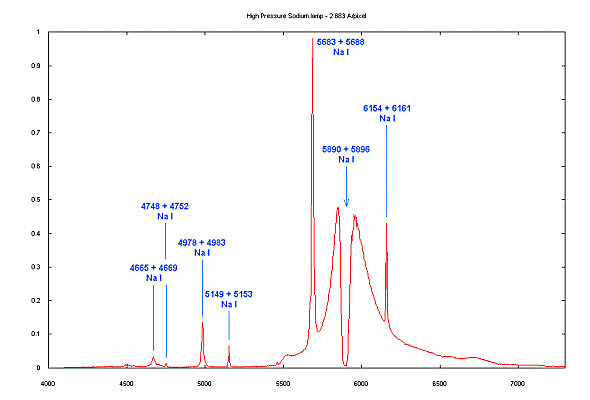
The sky light pollution of my city - High Pressure Sodium lamp types (Castanet Tolosan - France). The telescope is pointed toward a far street lamp. Note the intense absorption around the sodium D lines (self-absorption phenomena): the Fraunhofer absorption occurs inside the tube, along with the very broad wings of Na I 5890-5896 lines. Other emission lines are in the infrared part (not show here) : K1 doublet at 7665-7699 angstroms, and intense Na I doublet at 8183-8195 angstroms. The street lamps can be used for spectral calibration: it is the only advantage !
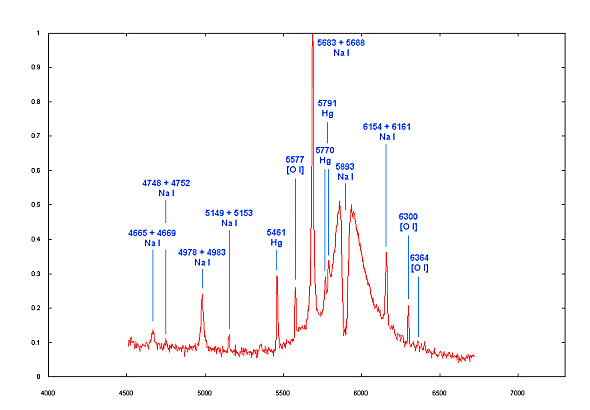
Next, sky spectrum at Castanet Tolosan (August 2002, a long slit spectrograph is used at the focus of a 5-inch refractor - click here for a description). The spectrum is very similar to the HPS lamp. It is not a surprise (mag. limit of my polluted sky is of 3), but we can see also evidence of Mercury (Hg) street lamp light, very faint trace of Low Pressure Sodium lamp (5890, 5896 A lines) and the faint atmospheric airglow [O I] at 5577 and 6300 angstroms (click here for supplementary informations about airglow) :
HPS street lamp view from my balcony observatory (Castanet-Tolosan observatory) !

The (near) infrared spectrum:

The
near infrared night sky of Castanet-Tolosan observatory. The sky
line emission background is here detected during an observation
of SS433 object with a LISA spectrograph (IR version - R = 800).
6000 exposure (10 x 600 s) on a C11 telescope. For more informations
about microquasar SS433 click
here. Click
on the image for enlarge.

Hight
contrast 2D spectrum of SS433. Click on the image for enlarge.

Negative
view of SS433 spectrum. The infrared spectrum is dominated by OH
rotation-vibration bands. You can note also the intense city pollution
doublet at 8183 & 8195 A. Click on the image for enlarge.
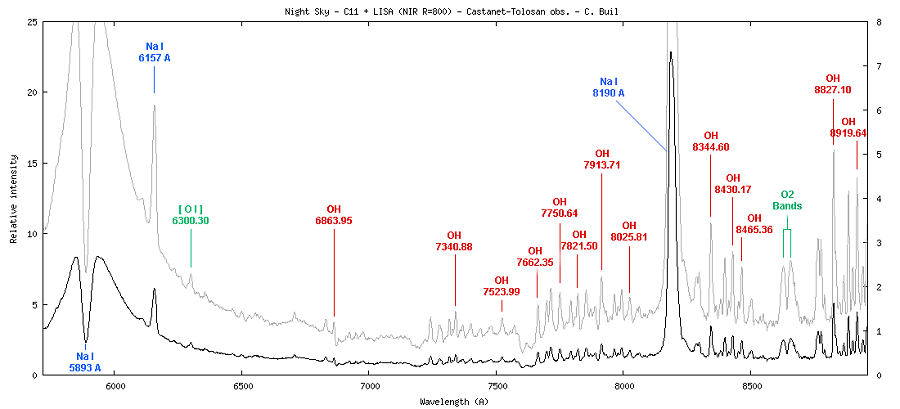
Emission
lines identification in the sky background of SS433 spectrum. "blue"
labeled line are artificial (HPS lamps). Note the telluric airglow
emisssion at 6300 A and the rich atmospheric OH spectrum. Click
on the image for enlarge.
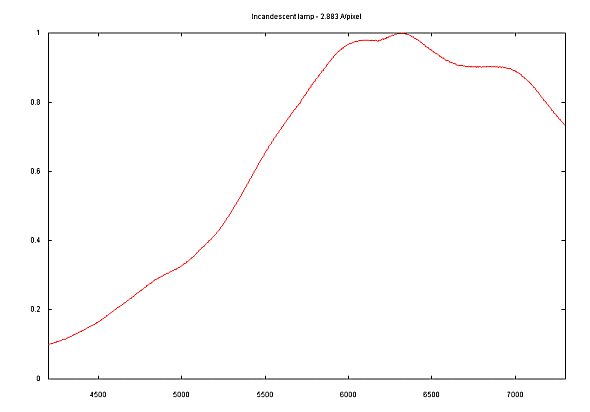
An incandescent lamp spectrum (continuum spectrum, no lines visible). The form is modulated by the instrumental responsivity i.e. optical transmission, CCD KAF-0401E spectral quantum efficiency, ...):
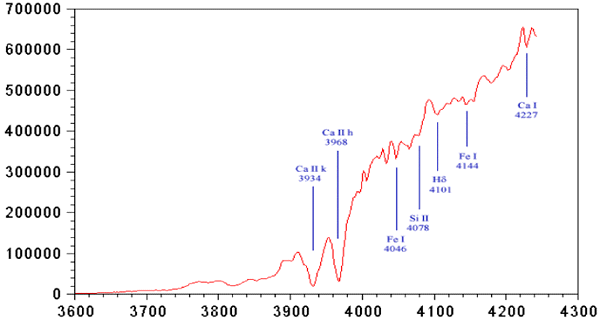
Of course, the star's proper lines can be used as a spectral reference if they are identified beyond doubt. The following image shows the spectral signature for Arcturus (type K2III) in the blue part of the spectrum. The H et K lines for ionized calcium are easily recognized because of their mere intensity.
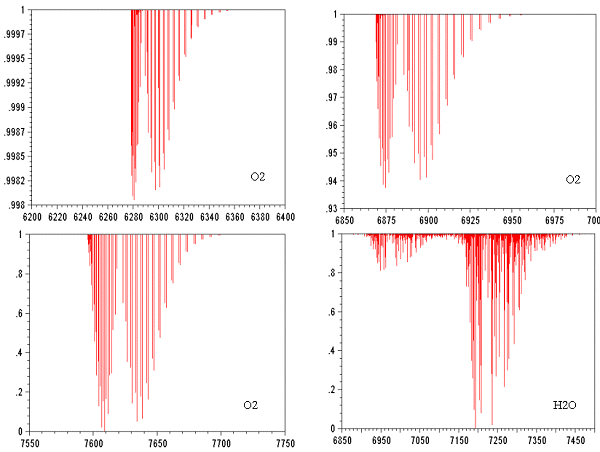
When there is no slit (or a large slit) and their are few stellar lines, scaling must be done using the telluric lines available in the atmosphere. In the following figure the red part of Vega's spectrum is shown, enhanced by the main atmospheric bands in the near infrared. Note that these atmospheric bands have a rather complex fine structure, and that one should be fairly prudent about their use. The next figure shows the resonance spectrum for O2 et H2O, extracted from a spectral databank of the earth's atmosphere.
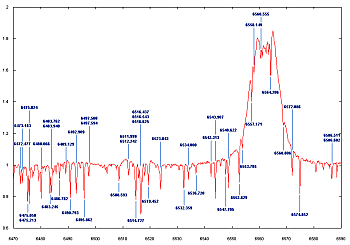
Click
here for identification of telluric lines in real and synthetic
spectra
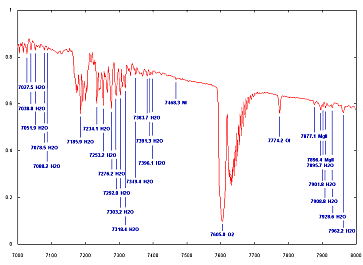
Click here for a full
commented spectrum of Vega
