|
Software
review
|
|
|
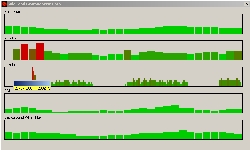
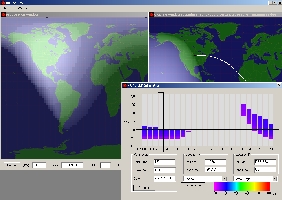
The "Solar
data" window and the cursor showing a K-index of 9 on
July 27, 2004. |
DX
ToolBox propagation analysis and prediction program (II)
Solar
and Geomagnetic Data
The
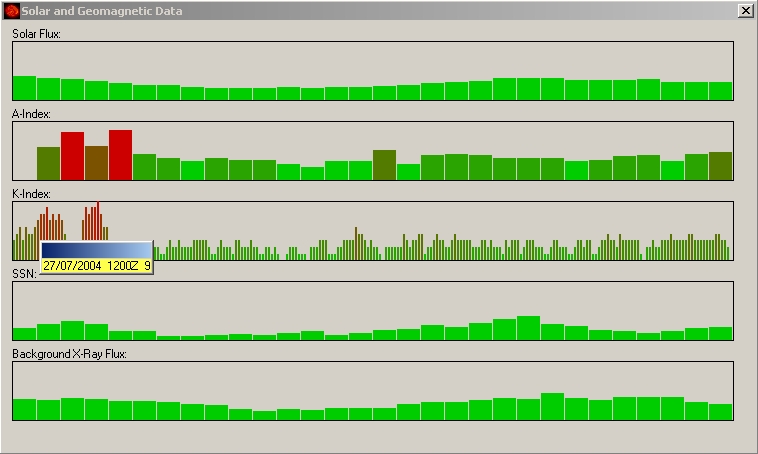
“Solar and Geomagnetic Data” window displays 5 bar-graphs with
the next readings:
-
Daily Solar Flux (named Fs or I or other products)
-
A-Index
-
Smoothed Sunspot Number (SSN)
-
Background X-Ray Flux
-
K-Index forecasted for the next 3 hours.
The
value of each plot can be highlighted by passing the mouse
over the bar.
These
data are a graphical representation of the GOES 10 and 12
satellite readings. They are as important as the X-ray flux. Higher
is the solar flux and the number of sunspots, higher will be
the MUF (maximum usable frequency).
A
low A and K-indices associated to a low X-Ray flux will improve the
propagation. However, a high individual value can break an
ionospheric layer too (K=9 for example is the sign of auroral
activity).
These
data have thus to be interpreted with care with a good knowledge of
the dynamic of the solar and geomagnetic activities, which obey to
very complex mechanisms where interact strength fields with plasmas.
In
all five charts, bars change gradually from green to red color according to the index
value. But at mid-scale the color is green-reddish, a bad color that
seems "fuzzy" or screen, not pleasant. I
suggested to the publisher to allow the user to change the color and
maybe the type of chart because the green-apple color looks a bit too
fluo on screen.
At
last as we told previously, if you work offline, if you try to open
this window the program displays an exception fatal error and shuts down. The same problem
occurs randomly working online in trying to open this window before any other one
excepted the Current conditions. This fatal error should be handled
by the system or corrected in a next released of DXTB.
Images
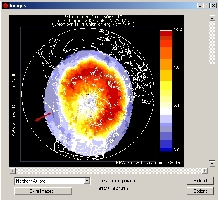
The
“Images” window allows you to display near-real-time images
or graphs downloaded from various servers such as SEC/NOAA
without user intervention but one mouse-click.
Among
the images downloaded, name the auroral oval, several maximum F layer frequency charts (related to
MUF) calculated over various parts of the world, the last images of
the Sun recorded by SOHO, etc.
Click
first on the “Options” button to lists all images that you
want to select/deselect and loaded. Click then on
the “Reload” button to reload all of selected images in a
few minutes.
In
addition, you can also specify other source of images to
download. Press on the “Extra Images...” button, then on
“Add” button, and you will get another combo message box
allowing you to enter a description and the URL of a
website. These additional links are saved in a separate text
file "ExtraImages.txt" that you can edit.
|
|
|
The
“Images” window. Here is the well-known auroral oval
extrapolated from NOAA-15 by NOAA. At that moment a strong activity is
developing over south Scandinavia and South Canada/ North
America correlated with other charts. The
“Extra Images…” button allows you to add external
links. Their list is saved in a separate text file.
|
Add
for example those images (Description and URL):
Pixie Dynamic Bow shock and magnetopause (static)
http://pixie.spasci.com/DynMod/gifs/movie1.gif
Sunspot
number progression (SWPC)
http://services.swpc.noaa.gov/images/solar-cycle-sunspot-number.gif
10.7
cm radio flux progression (SWPC)
http://services.swpc.noaa.gov/images/solar-cycle-10-cm-radio-flux.gif
NGDC
ionosonde
http://www.ngdc.noaa.gov/stp/IONO/image/R_t_gram.gif
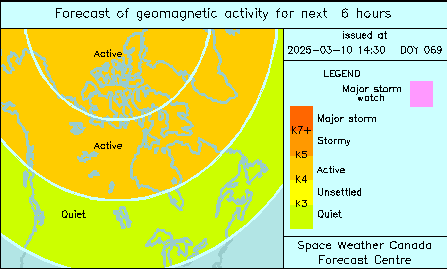
6
hours forecast of geomagnetic activity (Canada)
http://www.spaceweather.gc.ca/generated_plots/fcstmap3.png
The
two next images cannot be loaded as the file name changes from one
frame to another :
Belgium
digisonde
http://digisonde.oma.be/latestFrames.htm
Predicted sunspot number and radio flux (table)
http://www.swpc.noaa.gov/products/predicted-sunspot-number-and-radio-flux.
If
you are searching for other reports, bulletins or pictures to add to
this list, I suggest you to check the SWPC
Products and data Library.
Now,
to update the list you must close and re-open the
“Images” window for the changes to take effect. The new images will appear
at the end of the list.
Do not enter an URL to an image which name changes every day or you
will get an error… Select only those using a generic name.
NB.
On July 28, 2004, the publisher fixed a problem that happened when
loading images on XP/ME. Only the first or first two loaded. The fix
is installed in DX ToolBox version 2.2.0 exe file which is also slightly
smaller that the previous one.
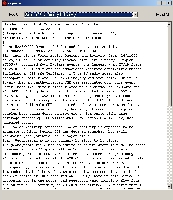
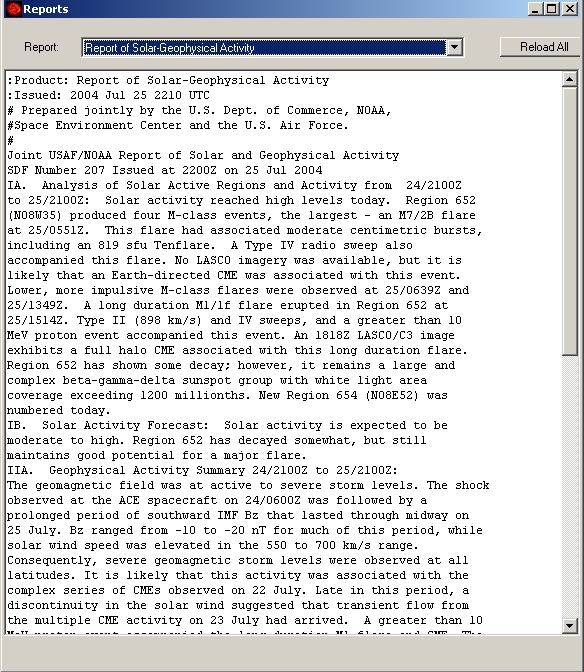
Reports
The
“Reports” window is very interesting to take knowledge of the
latest bulletins, warning messages and other text reports released by
observatories monitoring propagation conditions or the space
weather.
In
the current “Reports” window you can only read one report at a time. I
suggested to the publisher that it would
be interesting to create a multi-instance object of this window in
order to access simultaneously or so to several reports displayed in several
windows in order to compare easier several documents side by side.
These
reports come from the SEC FTP website.
Not all are “clear” and understandable for the novice or even
an advanced amateur. Most require to be familiar with the solar and
geomagnetic activity and some require even to know some codes to translate
figures in text… Excepted this, several reports are however accessible to
everybody.
|
The
following reports are available :
-
WWV Geophysical Alert
-
27 Day Space Outlook
-
45 Day AP Forecast
-
Geomagnetic Data
-
Daily Geomagnetic Data
-
Daily Particle Data
-
Daily Solar Data
-
GEOALERT
-
Daily Magnetometer Analysis Reports
-
Hourly Magnetometer Analysis Reports
|
-
Predicted Sunspot Numbers and Radio Flux
-
Report of Solar-Geophysical Activity
-
Solar and Geophysical Activity Summary
-
Solar Region Summary
-
Weekly Highlights and Forecasts
-
Current Space Weather Indices
-
Space Weather Event Reports
-
Daily Space Weather Indices
-
Summary of Space Weather Observations
-
3-day Space Weather Predictions
|
|
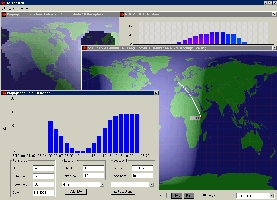
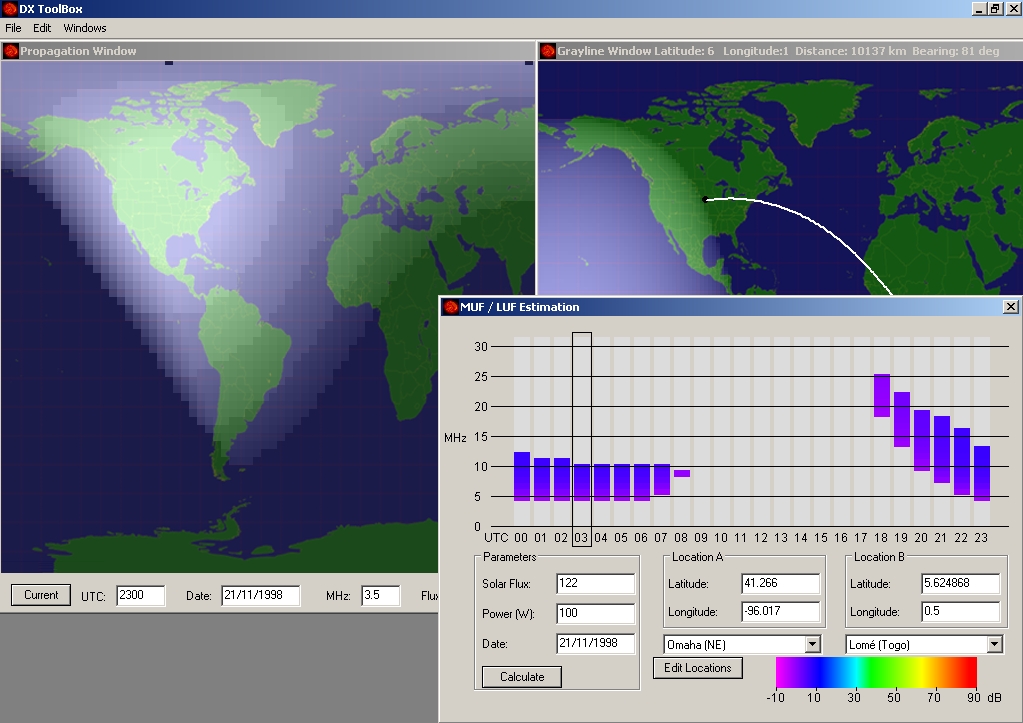
The Grayline Map
As its title suggests, this window displays a gray line map of the world
in cartesian projection. The gray line
is not correlated with the sun activity but we know that this line separating
the day from the night (also called the terminator) is the
location where low and medium altitude ionized layers vanish
on the night side permitting sky waves to reach the F-layer, and thus to reflect
further with less hops, and the opposite on the daylight side.
Using the gray line is an excellent method to reach far DX.
First
error, the program doesn't check the date format. The default format
is MM/DD/YYYY. If you enter DD/MM/YYYY the program accepts the entry
and calculates something even if the month is greater than 12 but it
doesn't update the map.
Thanks to the Propagation
Path calculator, clicking anywhere on to the Grayline map you can get the propagation conditions
at the target location, its longitude and latitude (roughly,
without decimal), distance in kilometers, as well as the
antenna bearing.
On request you can display the short path to the target
location but there is no possibility to display the long path and get a
propagation chart for this antipodal direction, although it
is often very useful to take advantage of the darkness to
reach far DX.
At
the limits of the map or close to the pole the program shows
also some erratic paths because high angular values are not
correctly taken into account (see p3).
DXTB provides also a beacon monitoring incrusted on the Grayline map.
You can get the location and call sign of the currently
transmitting NCDXF/IARU beacons
in selecting the right frequency (14100 kHz, 18110 kHz, etc)
in the scrolling dialog box displayed in the below right corner of
that window.
|
 |
|
At
left, the “Grayline Map” window with IARU beacons monitoring
activated on 14100 kHz. At foreground the "Propagation
map" predicts a 7 dB signal (S5) to 5Z; in the field in
was S1 only. At right, a forecast calculated for 100 W PEP from
K to TZ on 40 meters in fall time. |
|
For
the publisher, in inserting this feature the idea is to
allow you to (try to) listen simultaneously to the various beacons in
tuning your radio on their frequency. The next page devoted to SWL
activities recalls how work these beacons.
Most of them use vertical antennas (isotropic radiation) at medium or low power (100
W to 0.1 W) and help many amateurs to “feel”
the radio propagation conditions and openings toward such or
such country (or to be accurate from the DX to your location).
Added to the other tools provided with DXTB (Propagation path and
MUF/LUF estimations), you will better understand why such or such beacon
arrives loud and clear to you or is unreadable.
Sometimes
however, the signal strength estimation displayed in the
"Propagation map" does not match the
real conditions experimented in listening beacons or working
DX stations, that they are close or far away from your home.
We are here outside the capabilities of the program because
it is a prediction tool working with median and monthly
values, suited to estimate
future conditions not to "forecast" the current
status of the ionosphere in spite of its real-time updates.
At so short-term propagation conditions fluctuate at a scale
by far smaller than what permits the current ionospheric
sounding network.
That
said, to get a better estimation of the signal strength and chances to work such or such DX,
the program should also take into account a complete communication
circuit and not only the locations, date, time, SSN and the output
power. We will come back in detail on this
subject in the last page.
Last chapter
Propagation
Map
|

