|
Software review
|
|
|
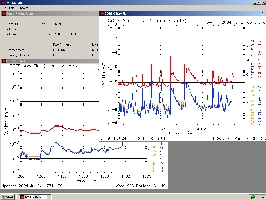
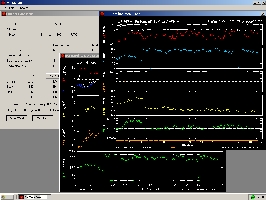
The
propagation program “DX ToolBox” with most of its windows opened, including images
and bulletins downloaded from Internet. |
DX
ToolBox propagation analysis and prediction program (I)
Foreword.
This review was written in 2003 for version 2.2.0. In 2020, DX
Toolbox is at version 5.5.0 (and beta 5.5.2b10). A demo version can be downloaded free of charge.
Its interface is similar to the version tested below. Note that an old
register number cannot be applied to the new version.
In
what shape is the ionosphere today ? IWith my modest means,
I searched long time for the answer without finding it. So,
one day I decided to search a program and useful information
to prepare my DX hunting or simply to understand why a band was
suddenly dead and subject to a blackout during
some hours or some days.
Browsing
the Internet I usually partly found the explanation in a
warning message dealing with the state of the
geomagnetosphere or with the solar activity found on a
public website.
This
information is long to compile and I had to connect almost
in real-time to a handful of professional websites (NOAA, IPS, ULCAR,
PIXIE, Spacew, and others) to get a clear view of the event
that happened… To avoid this tedious search I created my
own interface, a summary status sheet where these data are
automatically downloaded, but not all.
As
my sheet was not complete, I needed of an integrated product that
provided me all the required data online at the simple click of
a mouse. In addition I needed of a propagation program as realistic
as possible and using a user-friendly GUI.
By
chance, browsing the Internet I found a small program that I installed in
a few seconds, not memory hungry, occupying less than 15 MB on disk and called “DX ToolBox”
from Black Cat Systems. It works on Windows and Mac OS plaforms.
With “DX ToolBox”,
that we will shorten in DXTB in this review, is one of the simplest
and quite interesting propagation prediction program. It is an excellent complement to other
amateur products (see the review)
as its views or maps are different but complementaries to those provided by these programs.
Installation
The
installation of DXTB is straightforward : you
downwload the full version from the publisher’s website as a zip
file, you unzip it and run the exe ! There is not setup and
directory to create with a complex and long installation procedure.
All the application keeps in 5 files representing 14 MB on disk.
This is excellent and up to now the version 2.2.0 of the program runs perfectly and
without errors on my Windows XP Home Edition v2002, even while other
applications memory hungrier are running.
First
run : passed
At
first sight I didn’t understand how it worked. I didn’t want to
read the short manual because I desired an intuitive and easy to use
product as soon as the first run and I didn’t desire to dive hours
long into a tedious and complex manual to setup tens of parameters to
create a prediction, as other products do.
After
a few minutes of concentration on its various submenus and several
trials and errors I managed at least the main functions of the
product, and one hour later I mastered it… And in the forecoming
minutes I was even positively surprised by all its capabilities… At least !
Although
I had already some notions of propagations and astronomy (I am
interested in these fields since 1970 or so), these knowledges
didn’t helped me to master this good-looking and user-friendly
application. This is an application rather intuitive that requires at
the end relatively few inputs.
So
I can say that it is really accessible to everybody and provides
updated information. Therefore I decided to register it and to
show you its performance that deserve a try, even if in some
circumstances forecasts are not always reliable. But many other
products, even professionals, show similar gaps.
Requisit
What
surprised me first is the fact that DXTB displays a first window
with the current solar and geomagnetic conditions. They were
updated. How was it possible ? Was is a coincidence ? Not at all.
|
|
|
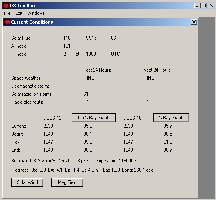
The
"Current Conditions" window when an Internet connection is
up. |
In
fact if your computer is connected to the Internet, DXTB searches on
the web for the information that it needs on solar and
geomagnetic activities that affect radio propagation. This
connection is done in background without user intervention,
hence the magic of this display.
DXT
provides indeed several tools (submenus) taking advantage of
these readings to create propagation forecasts and to display
real-time reports and images.
An
active Internet connection is thus warmly recommended to use DXTB in
optimal conditions because as soon as you request some features
related to the sun activity, the systems refers to its “Current
Conditions” window, and thus to online data.
If
you have no Internet connection you can hopefully use the program in
entering manually the solar flux in the “Propagation Chart” window
but avoid to deliberately request to check the solar and geomagnetic
data or you will get a fatal error that will close immediately the
program. We will come back on this feature.
If you have no information about the current solar flux download
this F10.7 chart
prepared by SWPC listing expected values for the current sun
cycle.
DXTB displays in near-real-time (when they are published) the next data :
-
Solar Flux (at 10.7 cm)°
-
Smoothed Sunspot Number (SSN)°
-
A-Index°
-
K-Index°
-
X-Ray Flux levels°
-
X-Ray Flares
-
Solar Wind
-
Earth's Magnetic Field
-
Radio Blackout conditions
-
Geomagnetic Storm conditions
-
Solar Radiation Storm conditions
°In addition these values can be plotted through submenus.
Menus
When you run the 12.6 MB DXToolBox.exe file, a main greyish
window appears displaying the current conditions, I mean the current
solar and geomagnetic data. Except this window, the menu is empty
and you wonder how it works….
So in a first time you instinctively browse the menu and
discover a first “Edit” menu in which you set your preferences
(Latitude, longitude and UTC offset) and later your registration code.
The
UTC offset cannot be simpler but I had preferred that the product
uses for example the Windows standard (e.g. (GMT+01:00) Brussels,
Copenhagen… ) and the standard TZ as do all serious applications.
But this is a very minor detail and the way it is used is really
simple and auto-sufficient. Go with it.
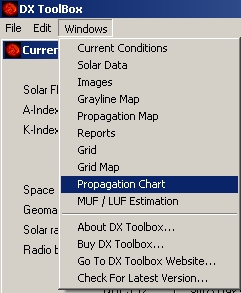
This is in the “Windows” and last scrolling menu that we
discover the hearth of DXTB, all its sub-menus, some
interacting with others :
-
Current Conditions
-
Solar Data (and of geomagnetosphere)
-
Images
-
Grayline Map (with in addition a propagation path estimation)
-
Propagation Map (with in addition a propagation path
estimation)
- Reports
- Grid (QTH locator)
- Grid Map
- Propagation Chart
-
MUF / LUF Estimation
In
addition you can check the latest releases, go to the
publisher website or access the help (a PDF file) from the
application.
Voilà
for short all options of this application. This is altogether few
and much, depending on your needs. In practice I think that with all
these data you have enough information to sched a good QSO with
a DX station and be informed in real-time about the status
of the space environment and the one of the
geomagnetosphere; you have all the information at once at your
fingertips up to the indigestion, Hi. This is a plus and one of the
two reasons (the other being the graphical user interface) that
pushed me to select it among my favorite propagation programs.
But
before going further and deeper into this product, come back a few
steps behind to review the default window, “Current Conditions”,
from where all begin and then all other cascading ones that depend
on this one.
Current
Conditions
The
“Current Conditions” window is the HQ of this application where
all real-time readings are compiled and keep updated by the system.
The refresh is automatic and each minute DXTB updates its data in
connecting to predefined web servers.
This
window must be opened all time, even in staying in the background.
If you close it, it will reopen as soon as the system will need a
real-time data to calculate its forecasts. Smart it is !
As
explained about the ionospheric perturbations, to establish a
propagation model, we need the next data that are display on this
window :
Solar Flux
This
is a measurement of the Sun energy recorded at certain radio
frequencies (2800 MHz, etc). A high flux (made of plasma,
hydrogen clouds, electrons, protons) directed towards earth
will have a strong impact on the ionosphere up to warm the
lower levels of the atmosphere (down to 100 km aloft) what
will alter the trajectories of satellites and create severe
disturbances on the ground as well (on gas pipeline, aerial
traffic, cellular communications, etc).
Higher
is the solar flux, better will be the level of ionization and
thus the propagation conditions via the E and F layers. Higher
is the ionization, higher will be also the frequency at which
shortwaves will be reflected by the ionosphere layers (MUF).
 |
 |
|
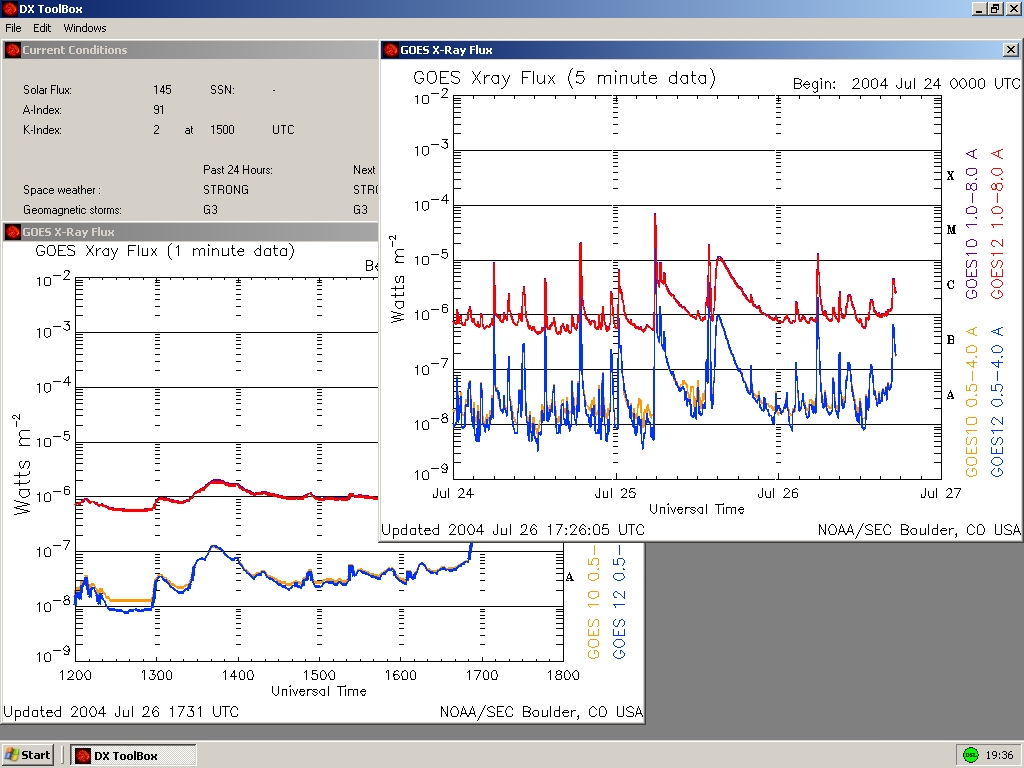
At
left, the "Current Conditions" window is the HQ of DX ToolBox
because this is the window where all readings are gathered in
real-time to allow the system to create its forecasts. All
data are automatically searched on the web and come from two
GOES satellites, 10 and 12, monitoring the sun activity from the earth
orbit. In addition, the solar and geomagnetic readings are also
displayed (solar wind speed, geomagnetic Bz component, etc). In the background the 1
and 5-minute X-ray flux showing some sunflares of C and
M-classes. No blackout or shortwave fadeout to expect, maybe
some noise, even though. At right, two additional windows named
"Solar Wind" and "Mag Field" have been included in v2.2.0. |
|
A-Index
This
is the "planetary index", often noted Ap. It is the mean value of the low
geomagnetic activity including a 12 hours forecast. When the geomagnetic field is disturbed, showing high values,
propagation conditions are altered. A-Index is ranging from 0 to 400. This index is calculated daily at the end of the day.
K-Index
Also
know as Kp, like A-index this a measurement of the activity of the geomagnetic
field but it gives a forecast for the next 3 hours. This value depends also on local
conditions.
X-ray
This
data is acquired from two GOES satellites orbiting around the earth.
They are correlated with the activity of solar flares. DXTB provides
the current readings, as well as the time, duration, the intensity
and the location of the last flare in heliocentric coordinates.
Two
additional buttons are provided : clicking on 5m X-Ray Graph
button will bring up a window showing the X-ray flux as recorded
from the GOES satellites orbit at a 5-minute update rate. The X-Ray
Graph button updates each minute.
The
most interesting graph is the 5-minute X-ray plot that allows to
foresee solar eruptions of C-, M- and X-Classes that are usually
available on SWPC/NOAA
website too.
Monitoring
the X-ray activity is very important because a high level of X-ray
generates much noises on bands, and when they are associated to huge
flares (also visible in white light) they may cause radio shortwaves
fadeouts (SWF) and even blackouts up to VHF if the flux is very fast and directed toward earth.
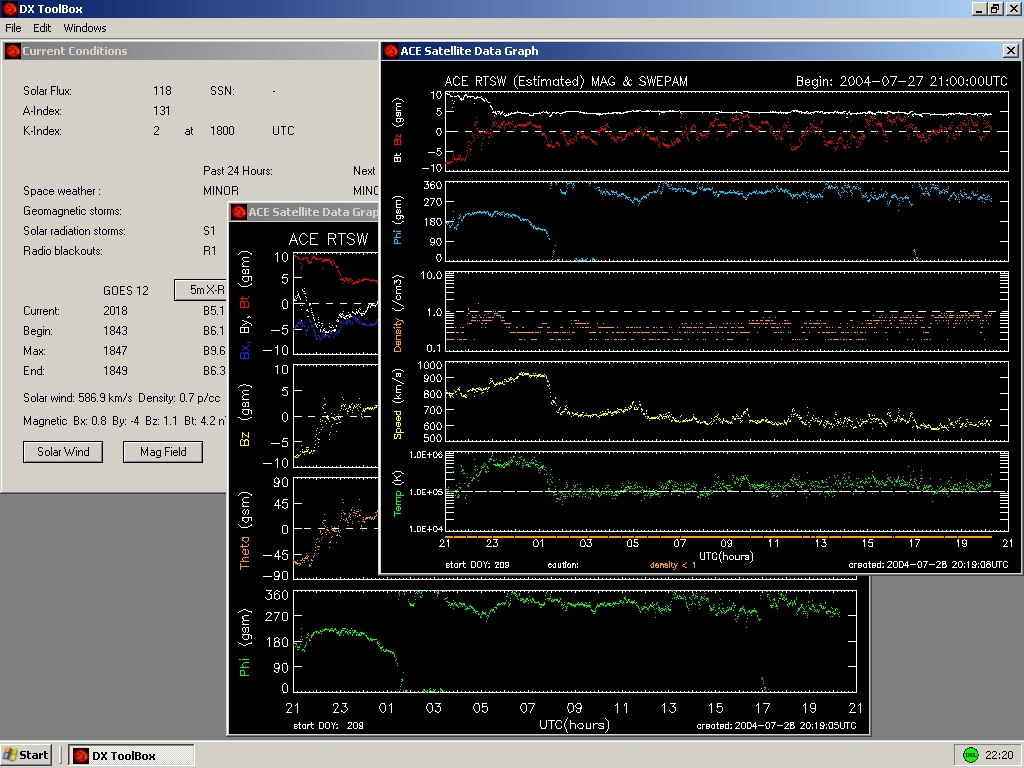
In
release 2.2.0 on DXTB two more buttons are provided in the
"Configuration Conditions" window, Solar Wind
and Mag Field to access respectively to the ACE Solar
wind and magnetic field data as displayed at right.
At
last various readings related to the solar wind and geomagnetic
activity are shown : solar wind speed, proton density, temperature,
geomagnetic Bz and Bt component, etc.
These
data are correlated with the solar flux and coronal mass ejection
(CME) from the Sun. The most important is the Bzcomponent of the
geomagnetic field which, if pointing
south (negative) with a high K-index,
means a deep alteration of the geomagnetic field with possible
auroral events and radio blackouts.
Next chapter
Solar
and Geomagnetic Data
|