|
Software
review
WinCAP
Wizard propagation analysis and prediction program (II)
Forecasts,
charts and reports This
is only after have entered all a circuit and both locations (home
and target) that you
can get a forecast. Time consumed : at least 1 minute per
circuit if you master the program and don't use the user batch
manager (see below), otherwise much more time... This
is the second major drawback of the VOACAP model : its settings are
long to configure if you want an accurate forecast reflecting the closer as possible your working conditions and all
the associated communication circuit. WinCAPw
does not display any map except the gray line (in azimuthal,
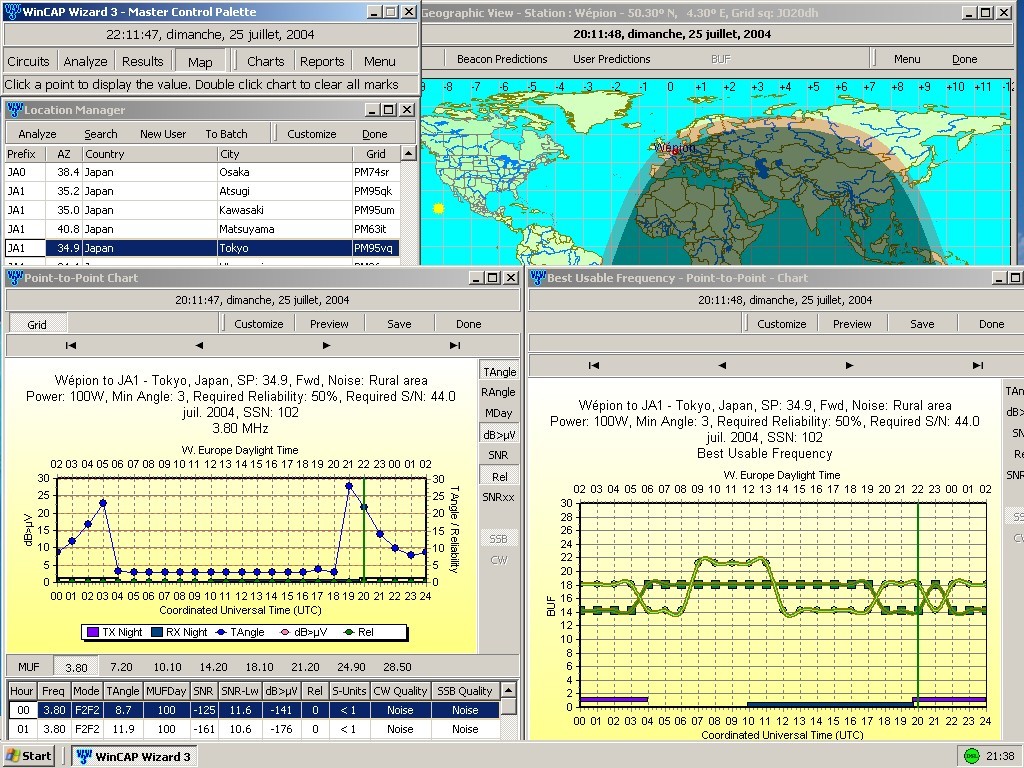
cartesian or spherical projection) with or without beacons. All forecasts are displayed in
two charts (MUF and BUF, and using colored dotted-lines by default) and as many text reports
as you activated reproducing the same data in a tabular form (much
less practice and readable).
|
|
|
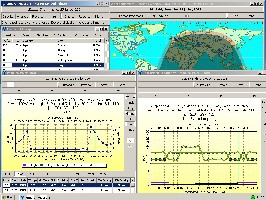
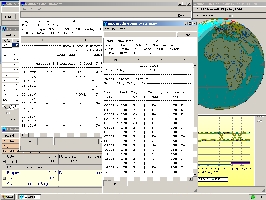
The
few charts (BUF and MUF) and map available in WinCAPw Wizard 3. |
There
are at least three methods to display a chart, two too much. When
all data are encoded in the various groups of the "Circuit" dialog,
select the "Location Manager" submenu in
the "Analyze" dialog, and double-click on a
target location to get a forecast; or staying in the "Location Manager"
window, simple-click on a
target location, then select "Analyze" in the
menu; or, at last, come back to the
"Chart" dialog, select the "Chart"
submenu, then click on "BUF". No,
really I don't understand the underlying logic of all these
options, except out of concern for some ergonomic
purposes and speed up some actions. However,
I recognize that if you already have selected your target
location you want maybe to access directly to the
"Chart" menu, and therefore you 'd select the
third option. But in this case why to not remove the
"Analyze" feature from the "Location
Manager" and, more logically, to use only the "Chart" dialog
to display the chart... That 'd make one risk less of
confusion.
That
being said, WinCAPw displays most of its results
either in chart or in tabular form (Reports), all static.
There is for example no propagation or iso-contour map available that
should be incrusted on a gray-line map or cross-section maps
of the ionosphere.
Reports
must be
printed; they are difficult if not impossible
to read on screen. However, these reports can be customized
or even disabled (see below).
WinCAPw
uses very few dynamic maps. There is only one, the gray-line map, in which you
can shift-click to get a BUF forecast with additional data for the
targeted location or use to monitor beacons. In all other cases you have to enter in each submenu item to modify
the individual fields, validate the change and rerun the chart or
the report. Note that the only other "dynamic" features
are the various circuits that you created and which forecasts can be
displayed one after another in point-to-point charts (see below).
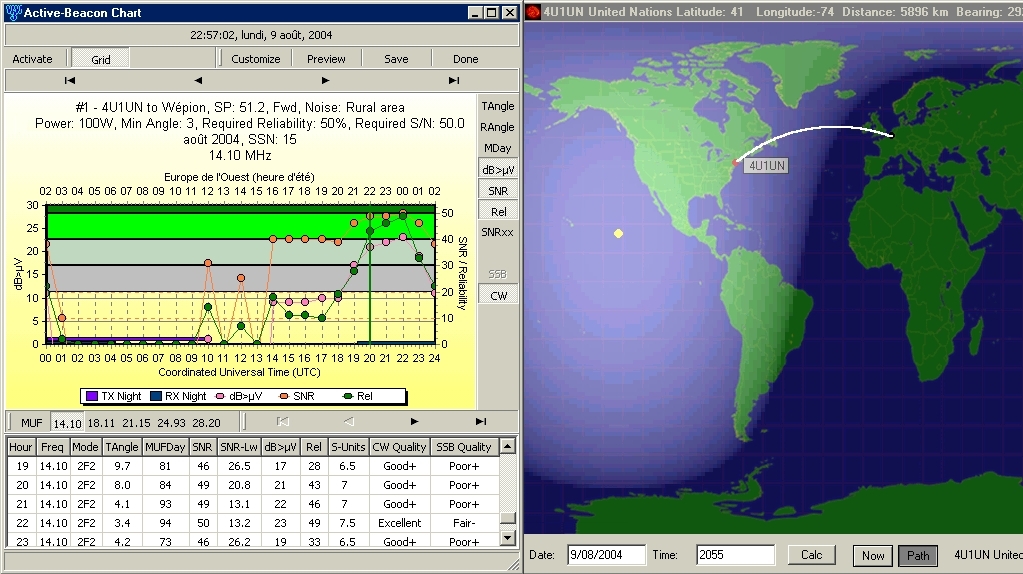
Beacon
Chart
Many
propagation programs create not only forecasts for
a single circuit but provide also a feature to follow in real-time
the 18 NCDXF/IARU beacons
installed on ham bands from 20 to 10 meters.
WinCAPw
supports this functionality in its "Charts" dialog,
selecting "Beacon", "Beacon Chart". A status window
opens and, using your default location and other data sets
previously encoded in the "Circuits" dialog (antenna,
power, reliability, etc) it calculates its forecasts
to (rather than from) your QTH. Depending of the speed of your
computer, the chart is displayed after some tens of seconds.
The
forecast reads a series of beacon data which list and settings are
available in the main "Menu" dialog, under "Beacon
Manager".
The
chart displayed is in fact a group of point-to-point charts showing
at your request various variables like any other chart (the takeoff
and receive angle, signal strength, SNR, Reliability, SNRxx) but of
course without BUF nor MUF except the fraction of the day during
which the working frequency is below the MUF, MDay.
Like
all predictions for multiple circuits, the beacon chart is in fact constituted
of 18 individual charts, one per beacon, that
you can browse one at a time using the arrows located below the
chart. In the main "Chart" dialog you can also ask for a
"Comparison Chart" that superposes all beacon forecasts on
the same chart... a big mess !, but that could be useful, I don't
dismiss the idea. Hopefully, in this mode you can only display one
variable at a time (e.g. SNR or dB>mV,
etc).... Ouf !
Positive
point, if this chart is static, like all others, the gray-line map provides a beacon
monitor (via the "Map" dialog, "Beacon
Prediction", then "Activate") that helps you to
follow propagation conditions online in tuning your transceiver on
the beacon frequencies (14100 kHz, 18110 kHz, etc). However there
is no physical connection between the program and your transceiver.
Contrarily
to other programs, the signal strength and SNR are displayed
in this "smart-map" geographic view near each
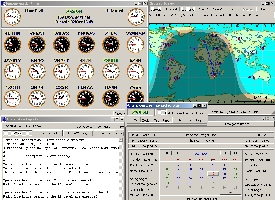
beacon (an option).
The signal quality of each beacon is also displayed in an
additional window as shown at left.
For
this review I run simultaneously two other propagation programs
including also a beacon monitor, HFProp
and DX ToolBox,
to evaluate the accuracy of WinCAPw
forecasts.
The propagation and band openings were check manually
in these comparison programs, for one beacon at a time.
 |
 |
|
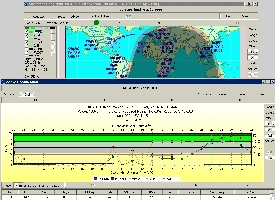
At
left WinCAP Wizard 3 Beacon monitoring and forecasts calculated for all
18 beacons. In this example the SNR is set too high (50 dB
instead of 38 dB or less). At right the main screens
available in Beacon-Time Wizard, a beacon monitoring utility
provided free with WinCAPw. |
|
I
was surprised by their results. Setting a power of 100 W in an
omnidirectional antenna, a 50% reliability and a SNR of 38 dB in WinCAPw, and taking only into account the date, time,
SSN, power, and the band in the other programs, globally
the three applications were on part and all predicted... as bad the signal
strength and propagation for beacons. The forecast was identical
using an output power of 1 kW, a lower SNR or a better antenna (Yagi).
That
already means that algorithms used by the VOACAP model are not necessary better, more
accurate, than those used in simpler programs in this matter. Bad for WinCAPw's
reputation.
The
three programs gave sometimes an excellent propagation from a beacon to
my location (low LUF, MUF over the working
frequency with a signal strength over 20 dB>mV
or S-7) or a high reliability (80-100) for a SNR of 38 dB (1 Hz) although it was unreadable with some noise or, conversely, forecasted
no propagation, reliability 0 with a SNR almost null (<5 dB) although the
beacon displayed a strong QSA (e.g. S-4 for KH6WO considered as
unreadable from ON in the simulation).
In most cases,
signals heard or that could be heard fell outside the forecast
calculated by WinCAPw. I couldn't believe charts : at the time of my
check, the propagation was so-called open, with an SNR close to 50
dB (very strong) and a high reliability over 50%, thus qualified as
"good", but no signal was heard during
several cycles extending over several tens of minutes at the
specified hour, and vice versa for other beacons ! That means that
this kind of forecast displays close to 0% of confidence or, said in
other words 100% of uncertainty, as the opposite value is often the
rule and more conform to the reality ! Conclusion, if you want to
use this feature to check propagation, set properly the SNR and
required reliability (check the help if necessary) and interpret these charts with
much care.
However,
there is at least one situation in which this feature is helpful;
this is when you can't recognize the beacon call sign transmitted in CW at 22
wpm. The gray-line map can be used to verify the propagation to and from each
of them. This is also an
excellent method to "feel" the propagation on the air before working
DX stations, but do not count too much on WinCAPw forecasts to know
if a beacon is readable or not.
NB.
WinCAP Wizard 4.1 now includes several additional "smart
windows" dedicated to propagation of NCDXF beacons, including a
quick chart in form of table.
Chart
settings and customization
All
data sets encoded in the various circuits are automatically added to
external data files that will be read by the VOACAP engine. These
text files (.dat, .inp, .out) are saved by default in the VOACAP
subdirectory \itshfbc\run. Most graphic settings are saved in the
folder \WinCAP\WW3.ini.
NB.
If you upgrade to version 4, the new engine will reuse the old
settings without renaming setting files and without overwritting
them, hopefully !
If
you do a mistake entering a value in a field, you have just to edit
the field and validate the data set (usually all fields displayed in
a same submenu or window) so that the new data will be available for
the system. But if you add a new record, it is sometimes easier and
faster to delete it or even to clear all data
at once.
Don't
forget, if the system don't remind you in displaying a warning
message, that each time that you modify a data, you must rerun the
analyze for the system takes your new conditions into account. Only
then you can request a propagation forecast.
The only objects that can
be saved independently are
reports in form of text files, and charts
in form of image (bmp, jpg, metafile) or data files.
 |
 |
|
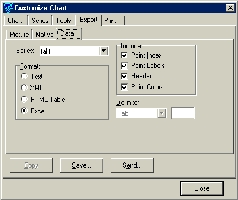
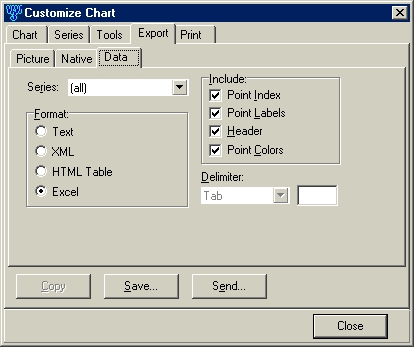
At
left the "Customize Chart" window available
only in charts ("Customize" menu) in which
you can set save, print, export and other chart
settings. At right some
of the reports provided to the end-user. All are static.
They can be printed as any document, edited on-screen
or saved as text files. |
|
Save,
print, export and chart settings can be configured but not logically
through
the main menu (the "Master Control Palette"), but rather in the
"Customize" menu of a chart. So, as long as you didn't
display at least one chart you cannot check its layout. Idem for the
reports : you have to display at least one report to verify fonts,
and what is more logical, to check the print preview or to save it
as text file. Like
in Excel any setting of a chart series can be modified up to the
color of the series, fonts, the border style or the gradient color
used for the background. There are here more options that necessary. You
can export series and the layout of a chart in text, XML, HTML or
Excel format. The size of these files is ranging between a few KB
(HTML, XML) to some hundreds KB (xls). After have seen what is
exported in HTML format you will quickly understand what are the
data saved in the Excel file.
In
this matter, WinCAPw
lacks seriously of a direct link to Excel; at
the time of the multi-session windowing
objects, OLE and DDE, its ergonomy could be much improved with
very few development although I feel that the
publisher tried to create a good interface starting from a
very complex application.
Note
that very few propagation programs
provide so many options to draw their charts or to print their
reports. In fact, most of them provide not the least option ! So WinCAPw
shows despite appearances one more time all its flexibility in this
customisation. Group
management
and User
batch Say
a short word about the various management options accessible in the
"Menu" dialog. These screens have been created to provide
you a global view of all groups and data sets that you are using to
establish your forecast. You can use them to compare several receive-system configurations,
system or even circuits configurations and select between them. When
you will be used to work with these managers you could use them to add, edit and delete
records as easily as using the different configurations in the
"Circuits" dialog. The
User batch manager The
"Menu" dialog gives you access to the "User Batch Manager".
It is also accessible from the "Master Control Palette", by clicking
on the "Analyze" dialog then selecting "User Batch". A
"user batch" is a sort of group or set of point-to-point
circuits using references to records stored elsewhere. The main difference
with the classical encoding method is that you don't have to change
all inputs between each prediction. If you need to change some particular parameter in one of
the three sets of records associated to circuits (consisting in a "system" record, a
"transmit antenna" record and a "receive system"
record plus two locations) you can only change it once using the
"Circuit Configuration Manager". Thanks
to relative addressing of references all other circuits using or
referencing that particular record (System, Xmit Ant, Receive) will also
be changed. At
last the user batch type prediction works the same way as the beacon type prediction, but
provides much more flexibility. If you regularly work with several
circuits, I suggest you to work with the User batch option. The
option being as complex as all others, you will
find more information about its settings in the online help,
"Tutorial - User batch" section. But don't be afraid to
look at its features, it is worth a try if you need of a tool to
manage numerous data widespread in many simultaneous circuits.
Last
chapter
Additional
help file and tutorial
|

