|
Software
review
|
|
|
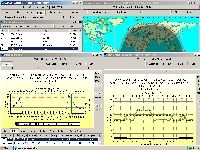
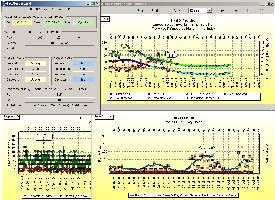
WinCAP
Wizard fully extended in the author's XP environment showing the
few charts and maps available. It is a VOACAP-based
application using a much more user-friendly GUI. |
WinCAP
Wizard propagation analysis and prediction program (I)
Foreword
- With the passing of Jim Tabor in 2010, WinCAP Wizard and other
Taborsoft products are no longer supported. So unfortunately the below
information is provided for archiving purpose.
*
WinCAP
Wizard is a propagation analysis and prediction program to not confuse with many
other homonym tools dedicated to computing. Based on the famous VOACAP
engine, a down-sized ionospheric model developed in the '80s, it is
as powerful and flexible as its model, in both meanings of the word,
but in my humble opinion, it presents always some inconvenients herited from its
mentor, until the publisher or even his creator had redesigned the
product and improved its performance.
WinCAP
Wizard, that I will shorten in WinCAPw for this review, differs
from VOACAP by its improved graphic user interface and the fact that
it is not free of right but a commercial product with all extensions
that it implies.
This
article reviews the version WinCAP Wizard 3. It was recently updated
to version 4.1 then 5 but as the interface hasn't changed, it only
includes new features, this review remains essentially compatible
with the new version. Changes are described in the second and third page.
Installation
WinCAPw
can be downloaded for a
60-day free trial from the publisher
website at Kangaroo Tabor Software.
For
the publisher, Jim Tabor, in releasing this Windows version, his
philosophy has been to provide the end user with a better and more
flexible user interface but using of
course always the same VOACAP engine,
without which WinCAPw should be well unable to predict the least
forecast. It installs thus also all additional models free of right
like ICEPAC, REC533, S_I_VOACAP, VOAAREA or HFANT from NTIA/ITS.
These "add-ons" are stand-alone but they share their data
with all models. We will come back on them later.
Other
heritage from the past, WinCAPw requires to be installed in a NON
long file name (LFN) directory (thus in a short name folder without
space, and not under "\Program files"). The funny side of
this situation is that the first official Windows version of VOACAP
was released in 1996 and the NT version in 1997, at a time of the
LFN was already supported in Windows 95... Soon ten years after its
introduction, using still DOS functions and text files, this tool
seems almost obsolete... Hopefully the GUI has been improved and WinCAPw
looks up the head thanks to VOACAP, one of the most powerful
down-sized ionospheric
model ever developed that
comes to light in all parts of this program.
|
What
is VOACAP?
VOACAP
stands for the Voice of America Coverage Analysis
Program. It is an ionospheric model predicting the
expected performance of HF transmissions. It takes
into account tens of variables to support you in the
planning and operation of long distance HF amateur
or broadcast transmissions.
VOACAP
was developed by the Voice of America (VOA) from the Ionospheric Communications Analysis and Prediction
program (IONCAP) developed by Teters and al. in 1983, itself based
on a Fortran77 version created in 1978.
In
1985 VOA adopted IONCAP as the approved engineering model to be used for broadcast relay station design and antenna specification.
Then
VOA funded the Naval Research Laboratory (NRL) to make specific changes to the IONCAP methodology, and renamed it to VOACAP so as to avoid confusion. That version of VOACAP was completed in April 1993 and distributed to participants at IES 93 (Ionospheric Effects Symposium May
1993, Alexandria, VA., USA). Simultaneous to funding NRL to enhance the model, VOA also funded
the National Telecommunications and Information Administration, Institute for Telecommunication Sciences
(NTIA/ITS) to enhance the user interface.
In
parallel geophysicists have worked on a more complete
ionospheric model called the International Reference
Ionosphere (IRI) from which have been extracted several
specialized models like the F2-peak model, also used in many
amateur propagation programs.
For
more information about VOACAP consult in L.R.Teters, J.L. Lloyd, G.W. Haydon and D.L. Lucas,
"Estimating the Performance of Telecommunication Systems Using the Ionospheric Transmission
Channel", Institute for Telecommunication Sciences, NTIA Report 83-127, July 1983. |
The
VOACAP engine represents about 14 MB of data, the whole application
requesting 23 MB of disk space. Here also we feel the heritage of a
product developed by a governmental agency and that was not
optimized. Resource hungrier, the first 32-bit beta release didn't
work on computer lower that a 80486 running at 33MHz equipped with math co-processor
and VGA display. Today, hold on well, the "suggested"
system configuration is a Pentium IV running at 2.8 GHz, 1 GB RAM
and a 20" XGA display... In fact NTIA/ITS suggests to run the
VOACAP engine on the plateform on which it has been developed ! As
if all users had always at their disposal the latest computer
model... Hopefully, even embellished with the WinCAPw interface, the
program runs fine of small computers like a portable Pentium II
running at 300 MHz with 128 MB RAM and a 14" SVGA display.
However to be at ease a 500 MHz CPU, 256 MB RAM, and a 17"
display in SVGA or even XGA resolution will be appreciated.
With
some habit you will discover that some of installed files are
samples or are seldom if not never used and that they can be deleted
if you need of disk space. As infered previously, the VOACAP model can be used
independently in running the command "\itshfbc\bin_win\Pointwin.exe voacap"
or clicking on the deskop folder "ITSHF" and selecting the
icon "VOACAP". The
"pointwin.exe" is the reference to the
"point-to-point" VOACAP interface, not an option designed
by the publisher. But leave temporary these tools on one side, we
will come back on them further.
First
run : press help !
WinCAPw
requires 15 seconds to load its graphic user interface
on a 500 MHz P3 with 256 MB RAM and some GB of free disk space. This
is the slowest interface I have ever used ! Even the original VOACAP
32-bit engine load faster. Hopefully WinCAPw runs as fast as any
other application once loaded.
This
program provides three kinds of forecasts : a point-to-point
prediction (between two stations), a beacon type prediction, and a user batch
prediction. It is mainly dedicated to work off-line to schedule past or
propagation conditions to come, from hours or weeks to years in the past or
in advance at the condition to use accurate inputs and know its
limitations.
In
fact like many down-sized ionospheric models, WinCAPw uses
statistical functions and smoothed data showing either a high
reliability or median values. Both extremes do not alway match the
needs of an amateur radio. In this context, WinCAPw must be
considered more like a modeling program able to simulate various
working conditions with high accuracy than a simple tool that would
come to support you while you are working on the air looking for an
open path to DX stations. It can do it, and it do it too sometimes very well, but in a way
that can be more user-friendly, with additional dynamic
maps, and taking into
account real-time data and additional parameters.
If
you use for the first time a propagation program taking advantage of
a VOACAP engine, the product is disappointed because after 15 seconds
of waitings, without the least activity on screen, it opens in an
unconventional small window without much information. It does not
respect totally the Windows GUI for example and this is disturbing,
even if this is a minor problem. Hopefully, if you read the
introduction screen when loading the program (do read it !) Jim
Tabor will learn you that he provided an online help. In addition
there is an external help file in RTF format as well (see
below).
|
|
|
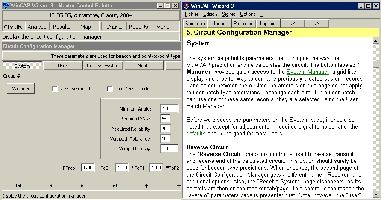
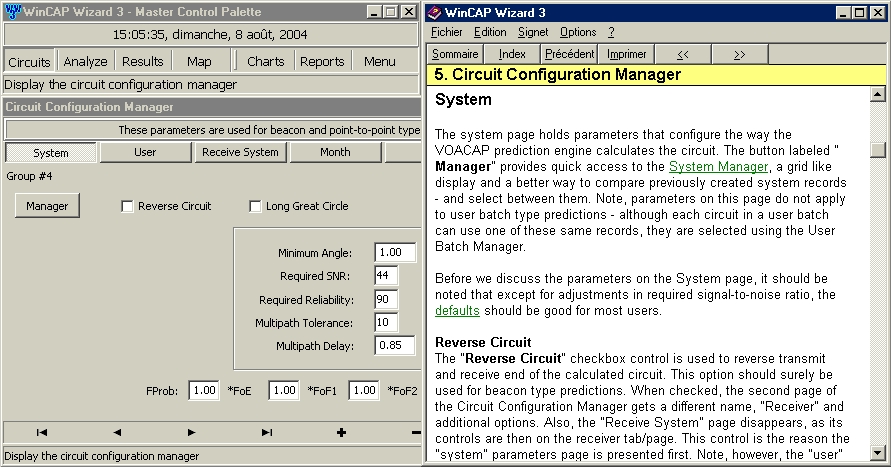
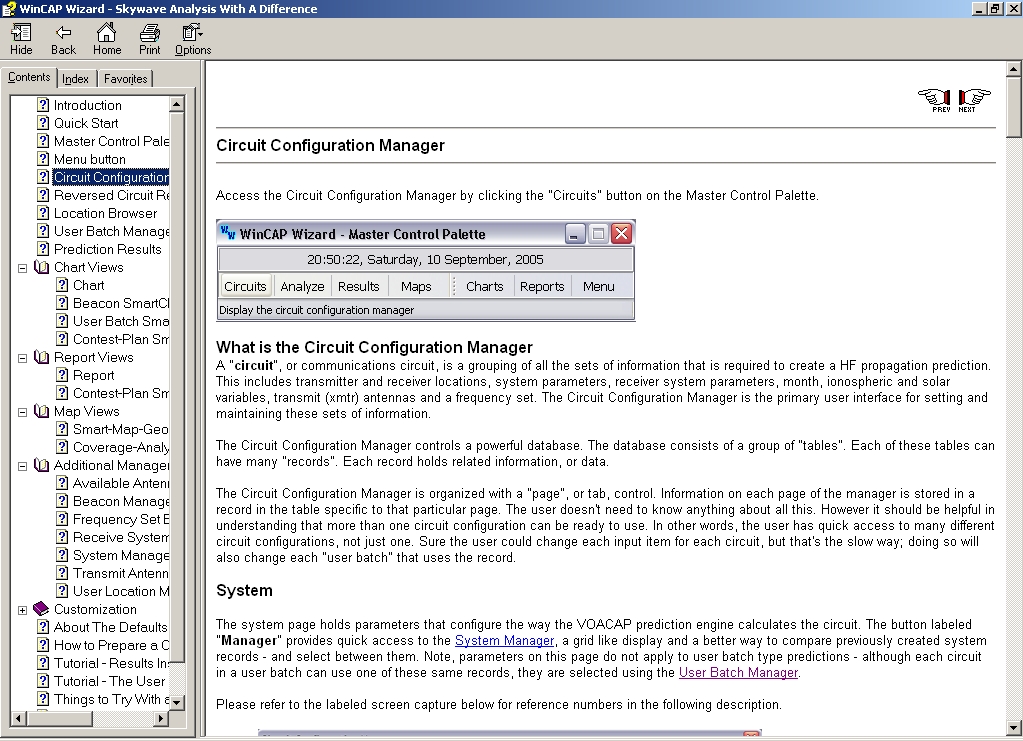
In
the upper left corner is displayed the WinCAP
Wizard 3
main menu window. Below it, the first "Circuits" dialog
has been selected and the "System" group shows some
settings that will be used by the VOACAP engine. At right the very useful contextual online help (at
right) that pops up pressing F1. Very useful in the beginning
as it is quite verbose... As explained next page, the help
has been improved in version 4. |
But
when you see the manual, very long (thick), full of comments,
field descriptions and figures, you prefer to bypass it
temporary and trying, with some luck, to get a chart...
But is it only possible knowing the complexity of VOACAP ?
Without
background, no, it isn't if you want quickly a chart, but yes,
it is if you take your time. Like many novices in this matter,
you will probably make trials and... errors
with the hope that the contextual help (pressing F1) will
solve your problems ! Of course this is not the
best way to get an accurate forecast if you even don't master your
inputs, and we will still underline this fact.
This
"trial-and-error" procedure can last quite a few times,
depending on your ability to master something new and maybe
much different from the programs you are used to handle. But
hopefully all VOACAP engine use the same inputs, and once you mastered one setting you
will understand quicker how to set another program using the
same data and algorithms.
Here
is how to proceed to get a chart with WinCAPw. Move first the small
Main menu window outside the middle of the screen, to a corner. Then
browse this menu for left to right to setup various parameters that
will be used to calculate propagation conditions.
Without
the least knowledge of the VOACAP model, you will probably get in
trouble in trying to enter your first inputs in WinCAPw, even with
the contextual help. Not that screens or fields to fill or to select
are badly labelled but without background you don't immediately
understand their utility or what value to enter. So before to begin
and if you didn't read it yet or if you are already in trouble, read
my review of ionospheric
modeling and then come back. You will find in this
document many useful information that you might immediately apply in
WinCAPw.
Now
many amateurs become not aware of the importance of all VOACAP
settings and keep the default values, even if it means to come back
later to (find back and) correct some fields. At least you will have understood
their utility and maybe learnt the only one useful lesson of this
trial : read the manual first !
VOACAP
settings
WinCAPw
obeys to the VOACAP "philosophy" what means that you need
to setup various data groups (e.g. user
locations, date, time of the day, transmitter, receiver, antenna
gain, ground properties,
frequencies, smoothed
sunspot number, system
reliability, multipath tolerance, etc), select
a target location before to make a forecast. But this is not all, because
WinCAPw is more powerful
and flexible that
this, and is able to take into account several configurations
simultaneously (several circuits each defined by one or more
transmitters, receivers, etc).
Thus,
to confirm my first remark, it is impossible to display
immediately a propagation chart without to get a warning or an error
message if you have not set you input data first.
Circuit
Configuration Manager
WinCAPw
allows you to simulate simultaneously up to18
circuits. By "circuit" the program means a complete
communication system including users on both ends of the
communication channel, both antenna systems, the transmitter, the
receiver, the working frequencies, and more.
So
the first menu button labelled "Circuits" is one of the
most important as it gathers all communication settings except
the target location.
If you work with
only one circuit or configuration, once you entered and validated
all data you can select a target location and display a forecast. We
will come back on this option. But if you use two or
more circuits you have to enter all parameters of
each group. If you simply want to see the performance of a second
antenna in the same working conditions, you must fill the required
section (e.g. pressing the button "Xmtr Antennas" in the
"Circuit Configuration Manager" window and add or create a
second antenna similar to the one you are using). If your object
(the antenna but also a location, etc) is not listed, adding a new
item is an easy thing as you can edit online all text files provided free
with the program in the \sample directory or any other custom folder.
 |
 |
|
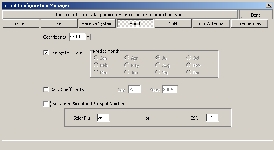
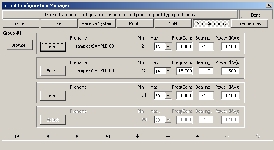
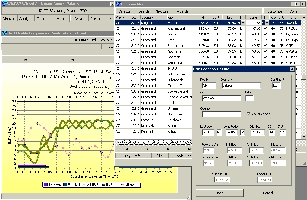
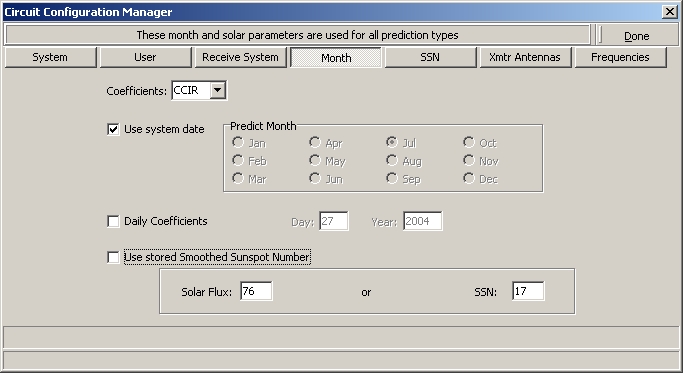
At
left
the “Circuit Configuration Manager” in which solar
conditions have to be entered manually as well as in
other submenus except if you install
"GeoAlert" in addition. At right another
window of the “Circuit Configuration Manager” in
which, if necessary, several antenna systems can be
setup if you want to simulate several working
conditions simultaneously. |
|
To
help you to manage your data, each circuit is gathered in numbered
groups, the all data set being managed in background by a
powerful database constituted of groups of tables that are
automatically sorted by the system and converted, if necessary, in
decoimal integer when it's a matter of coordinates.
With
some habit you will understand that the program takes into account many parameters in a very large range
of values from the antenna gain or the
output power to the QRM level to the receive station or the minimum
takeoff angle. Distributed in several windows, this section is very
complete and flexible, and thus a bit complex at first sight. It will require
surely a big effort and will be time-consuming if you have many
circuits to setup... But I bet that once you will be used to play
with WinCAPw you will be familiarized with all these settings
that will no more look so barbarian, HI!
Once
you are entered in the "Circuits" dialog or module,
first
big minus point, you discover that, as it, in the "SSN"
submenu, WinCAPw provides no link to the Internet to get online
updated solar data (from SEC/NOAA for
example). All values listed are in fact extracted from a statistical
database in which are saved offline all SSN for the sun cycle 23 (each SSN
value for each month between 1996 and 2007).
Hopefully, as for all records of the database, you can add new data to simulate conditions over that
range.
Get
online data with GeoAlert Wizard
|
|
|
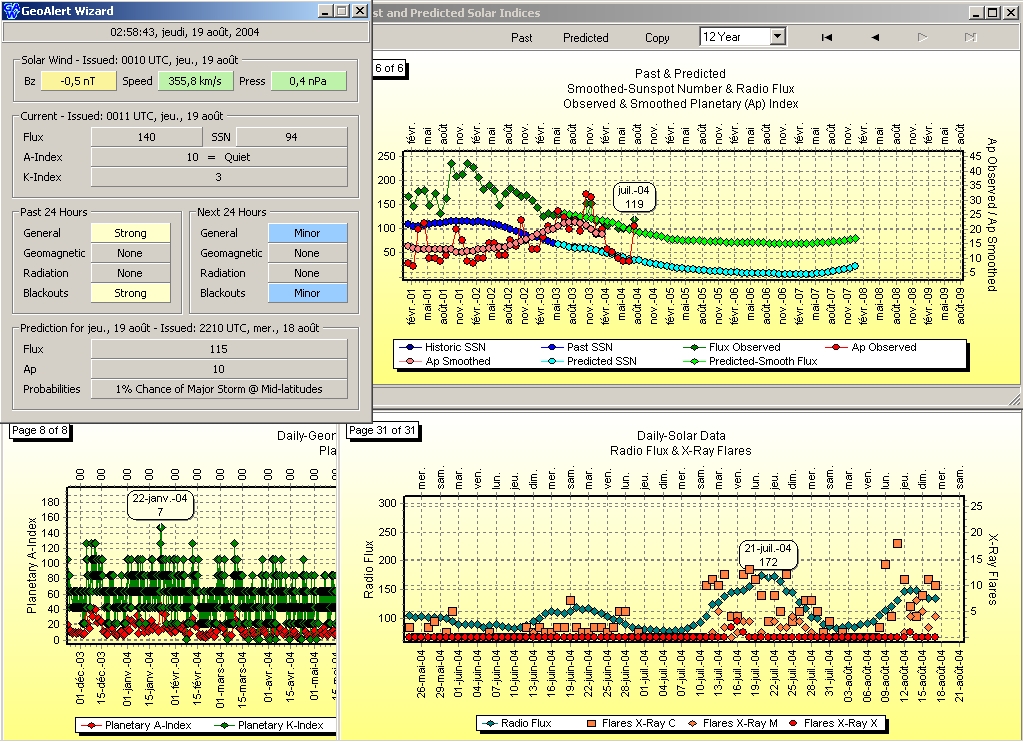
GeoAlert
Wizard display solar and geomagnetic data in a summary sheet
of in various charts |
Today,
WinCAPw provides an interface to get online data. “GeoAlert-Extreme Wizard”, a
$20 program currently provided free with the program,
must be installed into the same folder as WinCAPw for the
updates to be available to the program. A screendump is shown at
right. Then, in WinCAPw, open the "Circuits" dialog and
go to the "SSN" button.
There is a button labelled "Update" that is enabled when
new data is available. Just click that button when it actives and the SSN data will
be updated. Unfortunately this selection has to be manually executed
at each run and is not accessible in other dialog, window or chart.
No other data can be
either downloaded from the web. No
way to get the current geomagnetic data (planetary indices), to read online warning and
space weather reports, and no
way to get the latest images to correlate the current conditions or
warnings with conditions that you might experiment on HF bands...
Some
bulletins (WWV, a summary space wx report, solar wind plasma and
magnetic) are however available through GeoAlert Wizard (right click
anywhere on screen, then selecting "More").
Do
you always follow me ? Because we are approaching the last step of
our settings. Still a minute of patience and you will get your
chart...
Location
Manager
After
have completed all groups of the "Circuits" dialog and
validated each of them (pressing the button "Done"
on the upper right corner or the icon "a"
often displayed below right), you must now select a
target location in selecting the second dialog
"Analyze" and click on the first option
"Point-to-point...".
|
|
|
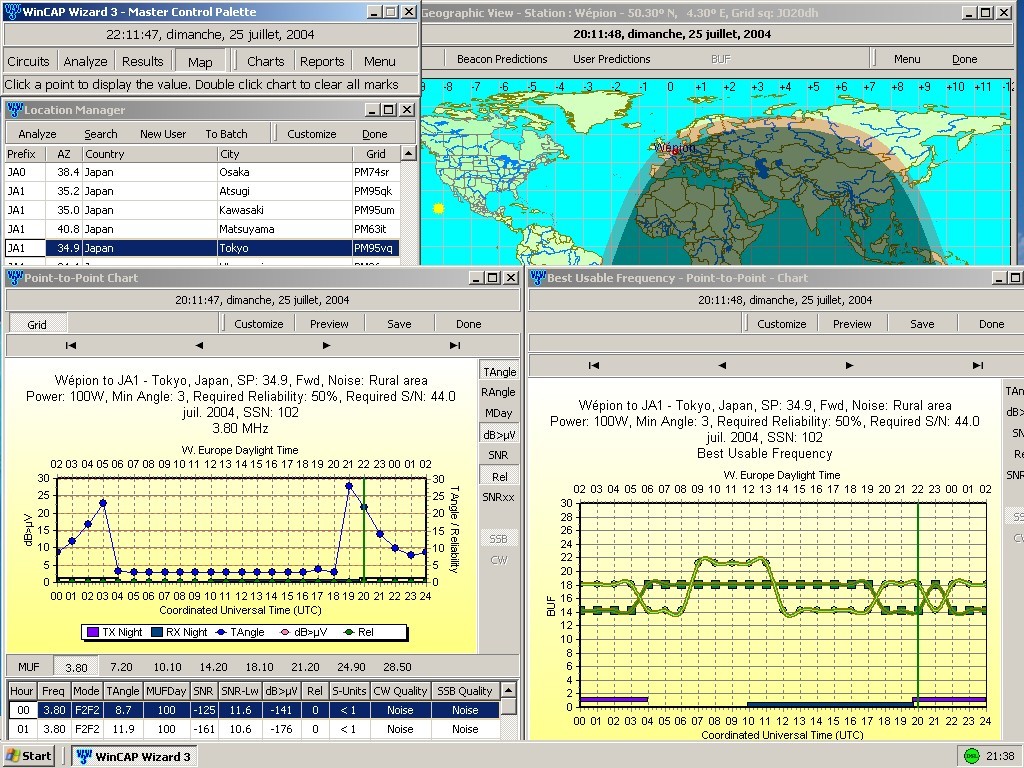
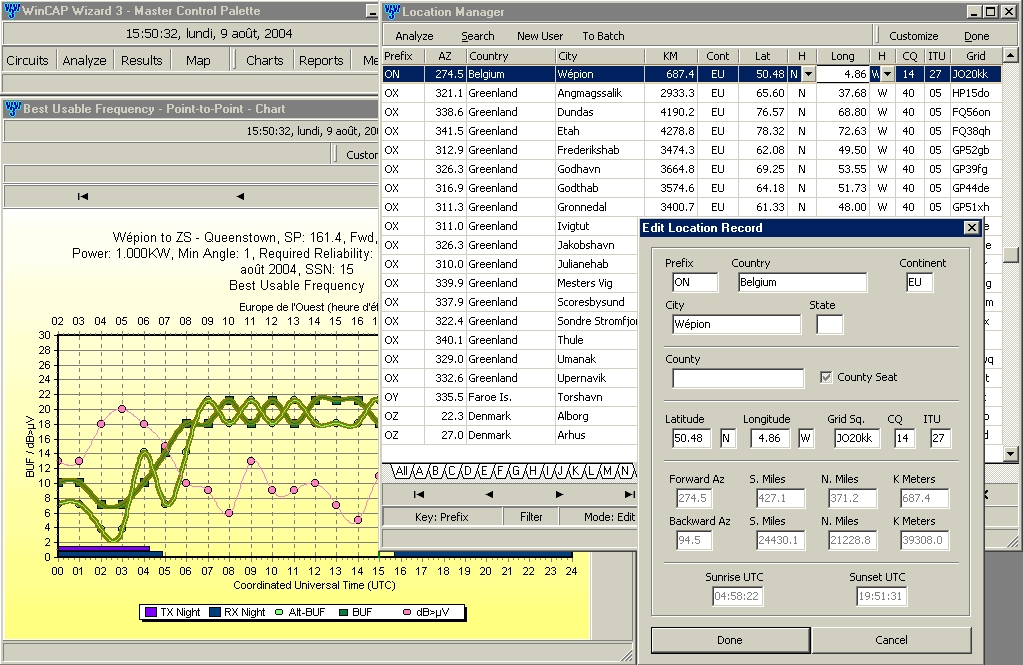
The
"Location Manager" superimposed on the BUF chart
that pops up either in double clicking directly on a target
location, or selecting a location then "Analyze"
in the menu, or using the "Chart" dialog, then
clicking on Chart, BUF. |
A
"Location Manager" window pops up as displayed at
right in which you can select, add, delete or edit
individual records. I evaluated the database to more than
6700 cities with their full coordinates. But your small city
or village gathering less 100,000 inhabitants in probably
not listed. It doesn't matter, you can add it if you want
! In
addition you can filter and search (setting first the key)
or sort the database to access quicker to a specific
location. As all fields, locations are very complete : WinCAPw
takes into account not only the coordinates of the
city (lat. and long. in decimal) but also the QTH locator,
CQ and ITU zone, and provides a distance calculator for both
forward and backward azimuths expressed in several units
(s.miles, n.miles and km).
By
default the program displays few columns but you can check
additional fields in the menu "Customize" to display more
columns and even move columns in the window. This is a true
object-oriented interface, at least one !
Note
as usual, that all these tables and data are also shared with the other
models like VOACAP or ICEPAC. We
will not extend longer on the other features of the program that are
mainly related to the customization, settings, groups and circuits
review and management. You
know enough of the program to create now a forecast. To be complete,
some additional
information will be provided further.
Next
chapter
Forecasts,
charts and reports
|

