Elbrus Home
Pulgar Home
ELBRUS: HOW DOES IT WORK ?
 Elbrus: como funciona ?
 Elbrus: comment ça fonctionne ?
THE PROCESS STEP BY STEP
Four steps:
- the star extraction,
- searching in the database,
- building the polygons,
- the image coordinates calculus.
- And a bit of theorie.
We start with a file containing an image with some stars:
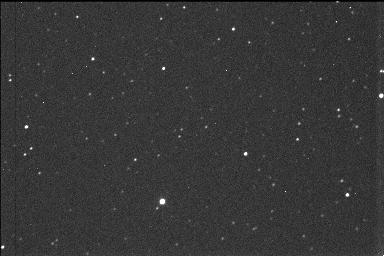
We read the image pixels. We consider that a star is formed with the pixels that have an intensity greater than the threshold and that are touching each other.
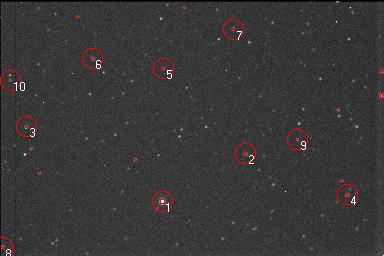
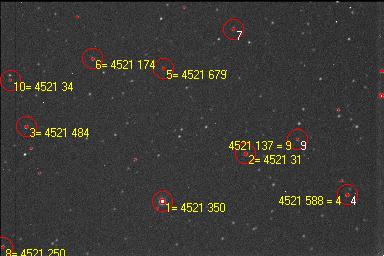
We use several threshold values until an adequate number of stars are selected. Then we select the 10 strongest of them. They are numbered with what we call the "sample number" from 1 to 10 .
We calculate the distances between the selected stars and then we fetch from the database all the distances that are equal to them (plus minus the error range).
All the obtained distances D1, D2... are used to build all the possible "V's" V1, V2... A "V" is formed by two distances that have a commun star number.
Then we form all the possible polygons P1,... based on the "V's". All the time we join together the vertices with the same star number.
Finally for each polygon, we calculate the MISSING sides (represented by ? in the figure) using the coordinates from the star database. If it matches the distance calculated from the image, we complete the polygon P1b, else we discard the polygon.
In the figure bellow all the sides (16) extrated from the distances database are drawn in white color. The red sides (20) are the calculated sides. For the final solution we choose the polygon with the greatest number of sides.
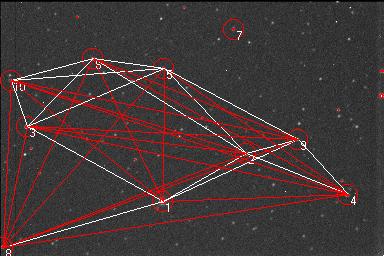
Here are shown the star numbers of the polygon-solution.
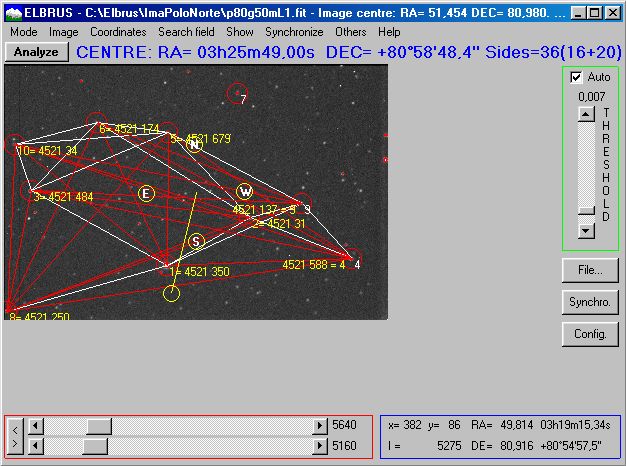
Using the coordinates of the identified stars, we compute the image center coordinates. That's all.
A BIT OF THEORY
The "distance object" in the sky:
The base of the shape recognizing algorithm of Elbrus is the element named "distance". It is the segment of big circle on the celestial sphere that joins two stars A and B. This element is characterised by:
- the angle AOB between the two stars as seen from the earth
- the inclination or angle NMB ( M is the center of the arc AB)
- the declination of the center M. Used for dividing the database onto files
- the right ascention of M. Used for discriminating when searching in the database.
Building the database:
In order to obtain a nearly uniform density limited catalog our target was:
in any sky frame with 15x10 arc minutes size, we select, from the original huge catalog, the five most bright stars. And we include in the database the 10 distances between these stars.
We scanned the full sky sphere, moving the 15x10' frame by 2 arc minutes step each time. First we move in the RA sense ( as H in the figure bellow ) and when the RA scan has finished, we move up in DEC sense 2 arc minutes ( as V in the figure bellow ) and then begin a new RA scan. The 2 arc minutes overlapping between successive frames assures an uniform star distribution.
For every frame position, we extract from the original huge catalog all the stars that are inside the frame. We select the brightest 5, then we calculate the ten distances between them and save the distances in the database.
The "distance object" in the image:
We calculate the distance between a couple of stars A and B in the image. This distance will be seeked later in the database. The supposition is done that our optical system is a single lens (L), and this works well. The angle we are interested in is the angle ACB in the next figure:
The database organization:
In order to accelerate the searh within the distances database, the distances are distributed into 180 files. Each file contains the distances whose center belongs to the same declination degree.
Each register has four fields:
- the inclination angle together with the distance in arc minutes (the index of the table)
- the register numbers of the two stars in the database file (two fields )
- the right ascention of the distance center
Each register of the stars database has three fields:
- the GSC number of the star
- the RA of the star
- the DEC of the star
Building the polygons:
Solving the image means identifying the stars in the image and giving them a catalog number.
-to the ten stars selected in the image we assign a "sample" number (from 1 to 10).
-in order to examine every possible solution, we shall use structures in which we store the star number of each "sample". These structures are named "polygons" as they represent polygons.
-at the beginning, every distance fetched from the database is stored in a structure-polygon.
Then we begin the "summing" process: from two polygons A and B we build a new one C that will contain the stars from both A and B polygons. Obviously this sum is done only when the compatibility conditions are satisfied:
- a sample number can not have different star numbers,
- at least there is one sample with the same star number in both polygons A and B,
- in the new C polygon, the distances computed in the image are consistent with the distances computed using the coordinates from the star catalog.
In the next figure we represent a few polygons. Each "sample" number ( red numbers 1, 2...10 ) has a box for the identification number of the star.
We can see that the polygons P1 and P2 are summed producing the new S1 polygon. Also P2 and P3 gives a new S2.
Nevertheless the P3 and P4 polygons can not be summed, because the sample number 10 has different star numbers: 14 in P3 and 747 in P4.
This process is repeated until no new polygons are created.
(updated 06-DEC-2007 Alfonso Pulido)
this is ... http://www.astrosurf.com/pulgar ... enjoying astronomy ...
Elbrus Home
Pulgar Home