![]()
The Be Stars
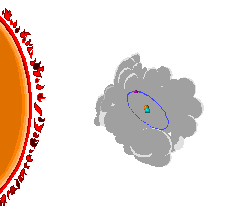
As scientific community struggles to understand with accuracy the origin and mechanisms of these emssions lines, one can note that Be Stars have an important rotation speed, and emission lines comes from external region of the star shell located at about 5 to 15 the stellar radius, region excited by the outstanding Ultraviolet energy generated by the core. These regions, cooler than the core, have conditions where recombinaison can take place and emission line can then show up. Questions then arise: why some emission lines becoming fainter with time, is this phenomena gradual or sudden? What is the proportion of B Stars which can become a Be star ?

Be Stars are B stars (10000°K) which exhibits emission lines from time to time in their life instead of the expected absorbtion lines. Are excluded of this study B stars of type I or II, for these spectral types, emission lines are not abnormal situation.
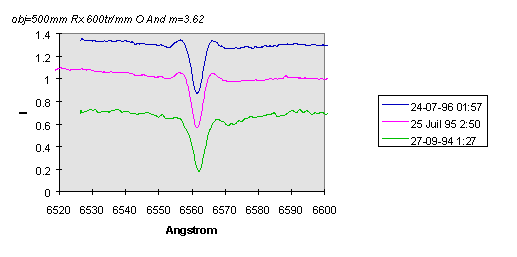
The study here consist in recording regularly Be star spectrum, over time, to detect conditions modifications like emission change or alteration of the lines. All the survey has been done on the H-alpha region.
![]()
As most of the spectra have been recorded at a sampling smaller than 0.1nm per pixel, no detector response correction has been applied. Only normalization of the profile as allowed us to compare spectrum and line intensity in a relative manner.

This example shows an evolution in the shape of H-alpha over time. The aim is not to explain the modification but at least to record them and to provide to professional trustable data which can be used in the establishment of more accurate models and theory.
![]()
Recording the Sun spectrum is a very good start to become familiar with the spectroscopy. Everyones has heard about the Fraunhofer lines. It is always excited to see them...

A line forest is immediatly visible. To find your way in this jungle, Visual Spec offers the help of a library of classical elements lines which can be superimposed on the original spectrum as a separated spectrum profile.

Sun spectrum with Na (Sodium) theoretic spectrum.

Sun spectrum with Ca (Calcium) theoretic spectrum.
![]()
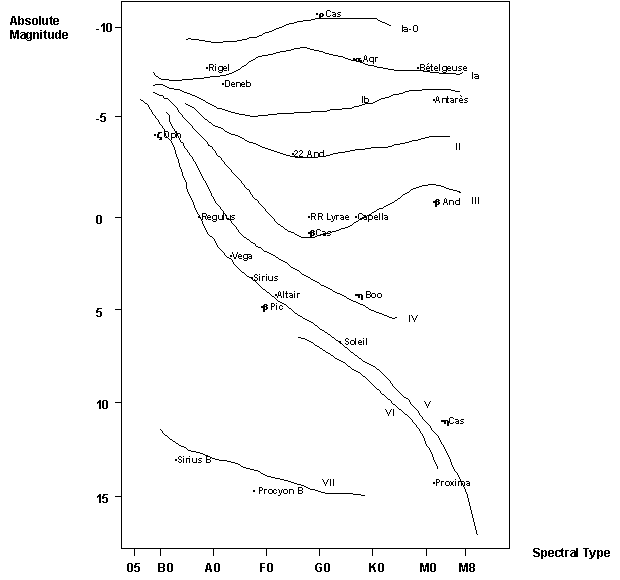
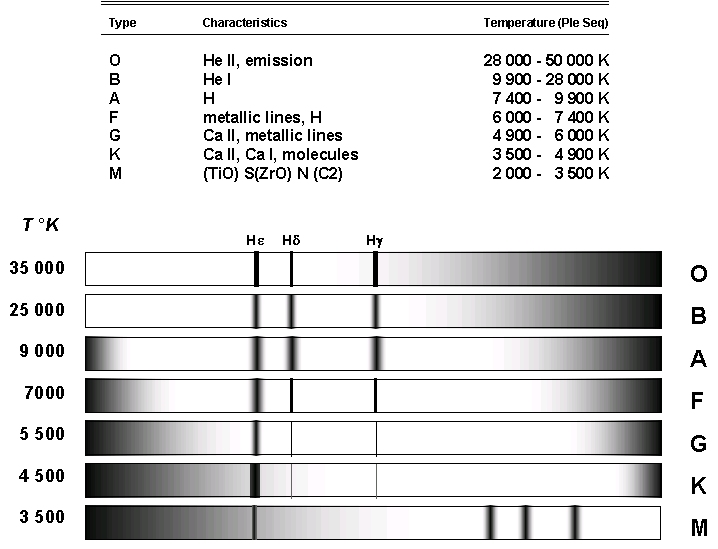
Spectral Classification is a way to arrange Stars per their temperature (planck law) and luminosity class (line width). The first spectral classification of stars was done by Pickering in 1901 at Harvard "Henry Draper catalog". Then came in 1943 the more completed classification 1943, at Yerkes Observatory by P.C.Keenan, W.W.Morgan and E.Kellman. The famous Herprunz-Russel Diagram is the consequence of this new way to classify stars.

The main class for Stars are named by letter and sub-class by numbers. The sequence of letters can be memorized easely: Oh, Be A Fine Girl (or Guy), Kiss Me... O class stars have the highest temperature.

Following are some examples of spectra taken by Chris Roughan, these are scanned photographies, transformed into *fit format and then processed with Visual Spec.
![]()

![]()

![]()
Planetary nebulae are a typical case where spectrum is showing powerful bright emission lines. This is due to the excitation of the ring by the central star. At the early times, no element where known on earth to be able to produce such emission lines. Scientific thou