|
|
|
Review of HF propagation analysis & prediction programs
58 programs at a glance
Unlike
the other programs reviewed up to now that are on-the-air oriented, these ones
are research-oriented or simulate some properties of shortwaves. Similar
programs have been developed in the field of astronomy
and many other fields.
Some
of these propagation programs are only accessible on the Internet through a web
interface and provide their solutions in graphical form. Some amateurs have also
developed small applications simulating various ionospheric effects. Using either
near-real-time data or renowned functions, most of them show a very high
accuracy.
Do not hesitate to give me your feedback
with any additional information.
DOS
Programs - Non-VOACAP - VOACAP-based
Beacon
monitors - Web
& Research oriented
|
|
PropLab Pro - IRI-2001 - CODE GIM -
IRI-2001/TEC
- PathSim
- IONOS - MICROMUF
|
|


PropLab
Pro
License,
$240
|
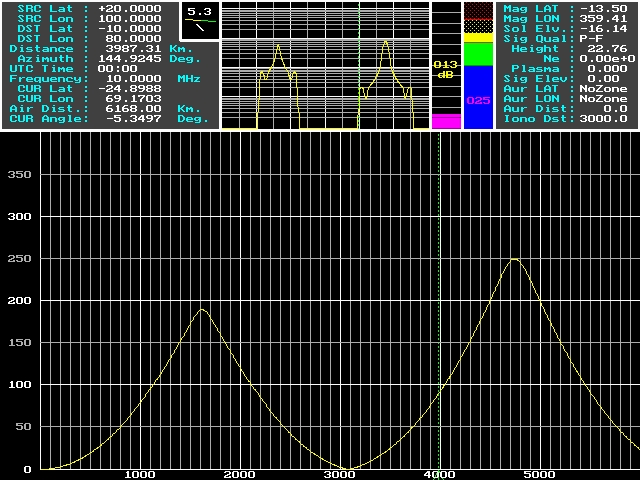
PropLab
Pro
PropLab
Pro 3 is available since 2007. It comes with a new interface. It is always the best simulation program available to
date for the advanced amateur or the professional.
PropLab Pro is a down-sized version of IRI and includes also the International Geomagnetic Reference Field
model (IGRF).
It is dedicated to simulation at high resolution and with accuracy of ray-trace signals through a realistic two- or
three-dimensional view of the ionosphere.
The
ray-tracing mode is like hop-testing as it just goes forward for a
given choice of radiation angle and the calculation stops if the
trace is lost to infinity or stops in the vicinity of the receiver.
But the main problem with that approach is that the hops may either
fall short or go beyond the target, making it a slow, iterative
process to get the path for RF from point A with point B. Beside
that, the user would have to evaluate the suitability of the path,
whether the number of E-hops would make it too lossy or otherwise.
The
2-D case comes fairly close to dealing with the problem in a proper
sense by putting in the appropriate ionosphere for each hop on the
path, considering date, time and SSN. But it does not take into
account terrain, such as the slope of the ground nor the nature of
the reflecting surface. Taking one hop at a time, the calculation
does takes into account the change in height of the ionosphere but
not any tilts or gradients. That is left for the 3-D case.
The
three-dimensional ray-tracing is based on solving equations of
motion for the ray path. There are equations for the path advance
along and upward in the great-circle (longitudes) as well as the
motion perpendicular to that plane, including the skewing of paths
in the HF, mainly to take into account the magneto-ionic effect on
the top band of 160 meters (Appleton's theory on gyration of
ionospheric electrons).
Here
are some features handled by PropLab Pro : Ionospheric Tilts, Chordal Hops,
Non-Great-Circle Propagation, Spitzes, Effects of the Earth's
Magnetic Field, Ordinary and Extraordinary Rays, Electron
collisions, Electron density, Signal Ducting (Inter-Layer Reflections), Gray-Line
Enhancements, Signal Strength of Ordinary or Extraordinary Rays, and
global maps like MUF, FOT, including antenna radiation patterns.
Now
at version 3, PropLab Pro is available for
all Windows 32-bit platforms. License from $240. No trial version but a free manual is available.
A forum is open to users.


|
|

NSSDC/COSPAR/URSI
Free access
|
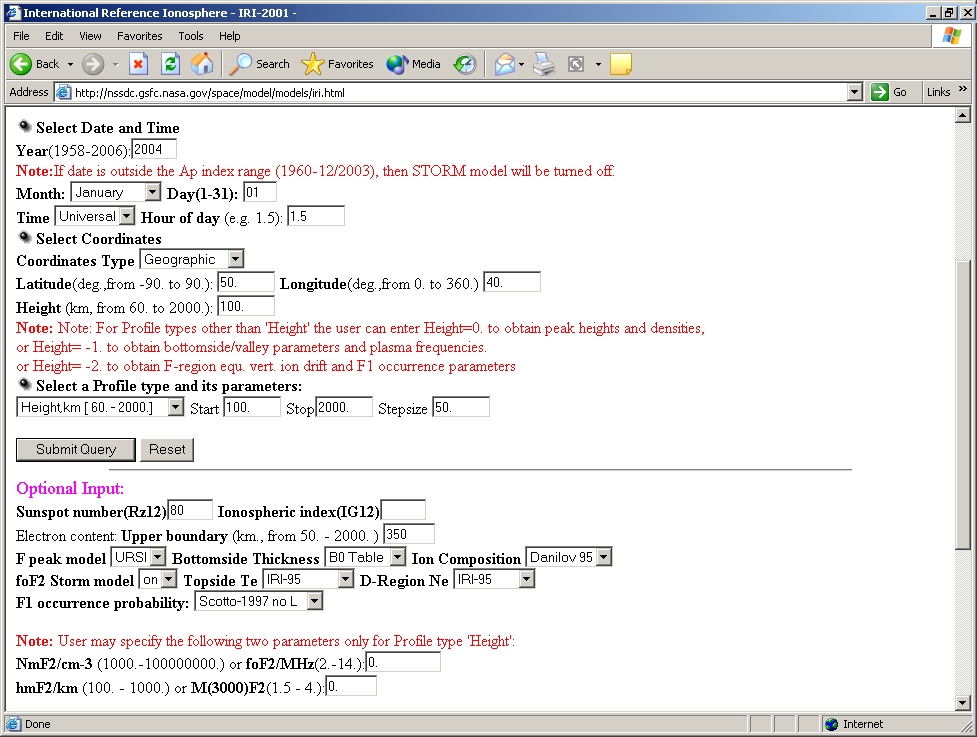
IRI-2001
This
is a web prediction form based on IRI-2001 model. This interface is
dedicated to professionals rather than to amateurs.
IRI
stands for International Reference Ionosphere. It is a general ionospheric model sponsored by the Committee on Space
Research (COSPAR) and the International Union of Radio Science
(URSI).
IRI
remains THE reference in propagation matter but very few amateur
products uses its power and the accuracy of its functions. Up to
date only DXAID by
Peter Oldfield and DXAtlas
by Alex Shovkoplyas use it.
This
form is not really a propagation prediction tool but an interface to
plot the electron and ion (O+, H+, He+, O2+, NO+) densities, total
electron content, electron, ion and neutral (CIRA-86) temperatures,
equatorial vertical ion drift and other parameters. This model is
supported by NASA/NSSDC. Cf. the NASA
IRI web page for more details.
Since
2012, a new model IRI-2012 is available on the NSSDC
FTP website.
The
IRI-2001 online version is available on NASA website via the old
IRIWeb interface.
IRI-2001
was available for Windows platforms from University
of Mass. Lowell site (no more now).
This
form is in free access. It requests an active connexion to the
Internet and a browser.
|
|
University of Berne
Withdrawed
|
CODE
GIM
This
is a web interface but it is no more available.
This
interface without input screen displays forecasts based on real-time soundings.
Global
ionosphere maps (GIM) are generated on a daily basis at CODE
using data from about 200 GPS/GLONASS sites of the IGS and other
institutions. CODE GIM results correspond to the results for the
middle day of a 3-day combination analysis solving for 37 times 256,
or 9472 vertical total electron (VTEC) parameters and one common set
of satellite and receiver DCB constants. In this way,
discontinuities at day boundaries can be minimized. Furthermore, a
time-invariant quality level is achieved. The VTEC content is
modeled in a solar-geomagnetic reference frame using a spherical
harmonics expansion up to degree and order 15. Piece-wise linear
functions are used for representation in the time domain. The time
spacing of their vertices is 2 hours, conforming with the epochs of
the VTEC maps.
|
|

University
of Leicester
Withdrawed
|
IRI-2001/TEC
This
was a web prediction form based on
IRI-2001 model. However it is no more available.
IRI is a general ionospheric model sponsored by the Committee on Space Research (COSPAR)
and the International Union of Radio Science (URSI).
IRI is the source from which have been
derivated various models to name electron density
models, electron temperature models, auroral
precipitation and conductivity models, F2-peak models,
geomagnetic storm model (foF2), etc. It incorporated also the CCIR noise model.
Since its release thirthy years ago, several
F2-peak models have been developed for the amateur
community among them
the VOACAP
signal model.
This
form plots a global ionosphere map showing the electron
concentration (TEC) taking into account several physico-chemical
conditions and parameters like the date and frequency. This interfaces
is as much dedicated to professionals than to
amateurs. It uses indeed an
user-friendly front-end written by Richard Beard from University
of Leicester, U.K. and displays its forecasts on a color world map
in cartesian projection.The same interface is used by the
université de Berne in Switzerland to provide a dynamic map of the
ionosphere, CODE GIM (see above) but based on a entirely different
data processing.
This
application managed by Chris
Thomas is no more supported since 2004.
|
|

AE4JY
Freeware |
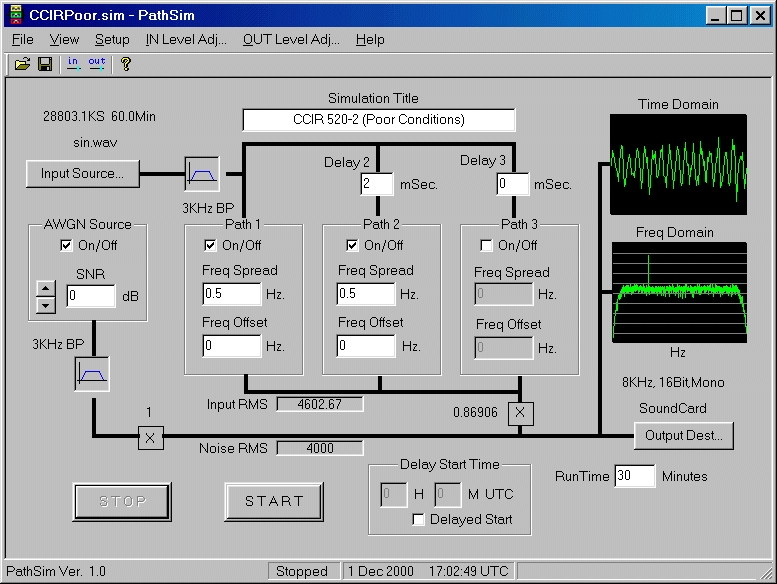
PathSim
Moe Wheatley,
AE4JY, wrote this Windows program in 2000 to simulate various radio propagation conditions.
Its main purpose is to be able to take audio input from either a soundcard or wave file, and distort this audio signal in a manner similar to how a signal is distorted by the ionosphere and other affects. This distorted signal can then be sent to a sound card or wave file. This allows comparing various modulation modes against various signal conditions.
The
main screen is fairly descriptive of the signal processing paths.
Three HF paths are available though usually only two are used.
Each
simulation "session" can be titled and saved to a file for
future retrieval. A set of canned simulations are included in this
zip file and are somewhat standard test conditions.
The
input signal is first bandpass filtered and converted to an I/Q complex signal
using a Hilbert transform (incorporated in the bandpass filter).
Three paths are then created with two of them having a variable time
delay. Each
path has a spreading frequency selection and a frequency offset
parameter. The spreading is performed by low pass filtering a
complex AWGN signal to the desired bandwidth and then multiplying by
the incoming complex signal.
Each
path also has a frequency offset function which is just a complex
NCO that is multiplied by the incoming signal. Just the imaginary or
real term of the three paths are summed together to create a real
output. Basically here's how the S/N ratio is achieved. The AWGN
source is filtered by a 3 kHz LP filter to bandwidth limit the noise.
The input signal's RMS "voltage" is measured and averaged
over a second or so. There are two gain/attenuator blocks that are
varied to achieve the desired S/N ratio in dB. The noise and signal
are then added to produce the final output signal. A small FFT and
real-time output plot are available to monitor output signals. The
time plot turns red if you are overdriving the 16 bit
soundcard/wavefiles.
For
all Windows plateforms. Additional files are available on the
author's website (manual, source code, MathCAD files). Requires a
computer equipped with a soundcard, and a connexion to a receiver
in option if you want to work with real signals.
For
all Windows 32-bit platforms.

|
|

DL6IAK
Freeware |
IONOS
Written
in 2000 by Michael Keller, DL6IAK, this very interesting program
based on the Watterson
model simulates
various
ionospheric effects for two paths which frequency deviation is
ranging between -30 to 30 Hz. Effects simulated are doppler spread
fast (0-2000 mHz or 2-80 Hz), time delay for path 2 (0-10 ms), a
gaussian noise or SNR at
4 kHz (40 to -40 dB), and drift (0-1120 Hz/min). The input file can
be either an internal 1 kHz tone (default), a .WAV file or a signal
coming from the soundcard. File output is directed to a .WAV file too.
This
program can be used in real working conditions or to simulate some geomagnetic
effects (storm, aurora, etc) or more simply the multipath
time delay took into account in some advanced propagation prediction
programs.
For
all Windows 32-bit platforms.
|
|

Pete Costello
Withdrawed |
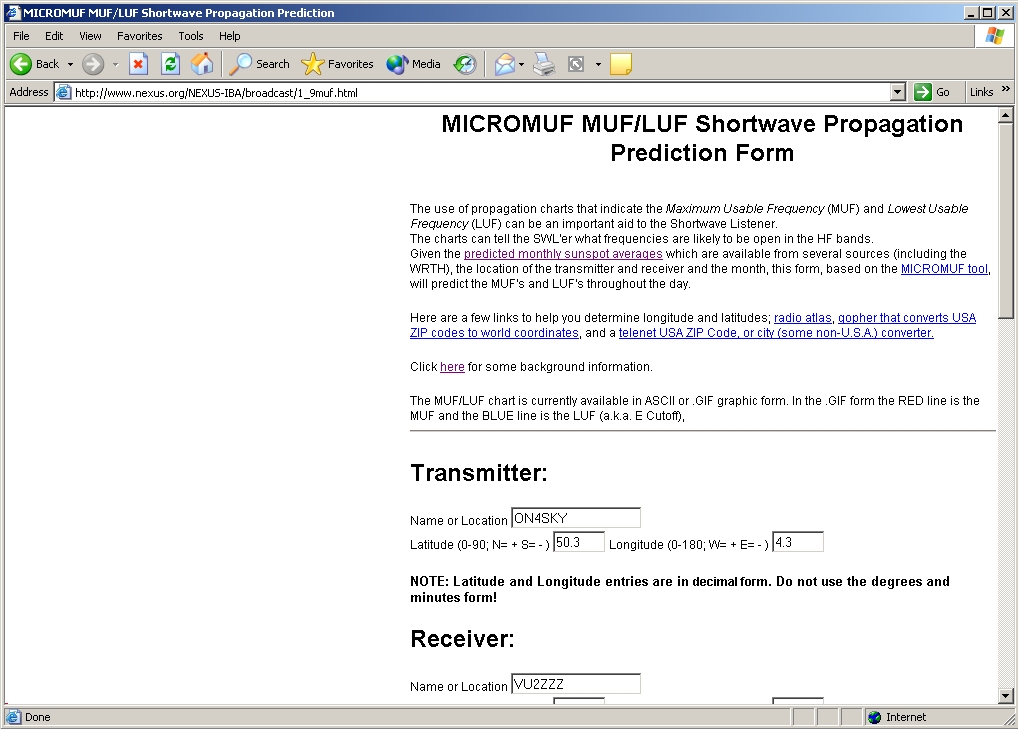
MICROMUF
Since
December 2004 the form is no more available from Nexus.
This
web form has been developed by Pete Costello for Unix. It is based on the
first MICROMUF
prediction program written for DOS in 1984 by Hans Bakhuizen, Technical Policy Adviser of Radio Netherlands.
This
is a point-to-point prediction program using the SSN and locations
as inputs. It only displays the MUF as shows the same approximative
result as its mentor.
Requests
an active connexion to the Internet and a browser.

|
Back
to Menu
|