|
|
|
Review of HF propagation analysis & prediction programs
58
programs at a glance
While
listening or planning to work a DX station, the radio amateur would like to know
what are the current propagation conditions, know if the propagation is open toward a
specific location at a specific time, or at what time the band will be open for
a specific point-to-point circuit. At
other occasions, the amateur notes that the band is suddenly dead without apparent
reason and open again after a few hours of true blackout. Knowing the whys hidden
behind such behaviours can help the amateur in understanding how work the space weather,
to help him to prepare his ham activities, specially his search for DX stations.
We
will see that tens of parameters can be taken into account to calculate an accurate
forecast. With a ham community counting more than one million active hams, these programs
are numerous but their accuracy as their complexity are various.
The most accurate
programs are VOACAP-based applications
that we are going to review below. They are on-the-air oriented and show an excellent
accuracy if you know the limitations of algorithms as well as the
meaning of each parameter, specially setting the SSN,
the reliability or the S/N ratio where a wrong data can false all your forecast, and
for example predict a poor signal strength and a band closed although it is wide opened with a strong signal !
There
are at least two kinds of VOACAP-based applications : the ones running VOACAP
algorithms without correction and those, very few, having added new functions to
improve its accuracy under some working conditions (e.g. geomagnetic
effects at high latitudes, equatorial scattering, DX over 10000 km, etc.).
But VOACAP displays some
limitations. Currently there is no way to
adequately model global irregular variations in the ionosphere on a time
scale smaller than a month because random values cannot be predicted. But they
can be described statistically or take into account using near-real-time data. In
the same way, DX forecasts over 9000 km are calculated using an empirical method
based on the LUF-MUF frequency range and cannot practically take into account
all possible propagation modes.
It
is why the VOACAP engine produces monthly medians, deciles, standard
deviations, probabilities of service, etc. Such statistics are predictable and
accurate although predictions for a particular date and hour are just speculations,
using interpolations that are not supported by VOACAP. In addition, no
application considers weather conditions or gyro-magnetic effects for
top band propagation. Furthermore, VOACAP is still a "trial version"
using not less than 30 calculation methods, some of them having never been
cross-checked with on-the-air results, and are thus not validated by users and show some
errors in some specific conditions of use. In spite of these limitations, the
VOACAP engine remains the most accurate and flexible down-sized ionospheric
model available for the radio operator.
Do not hesitate to give me your feedback
with any additional information.
DOS
Programs - Non-VOACAP
-
VOACAP-based
Beacon
monitors - Web & Research oriented
|
|
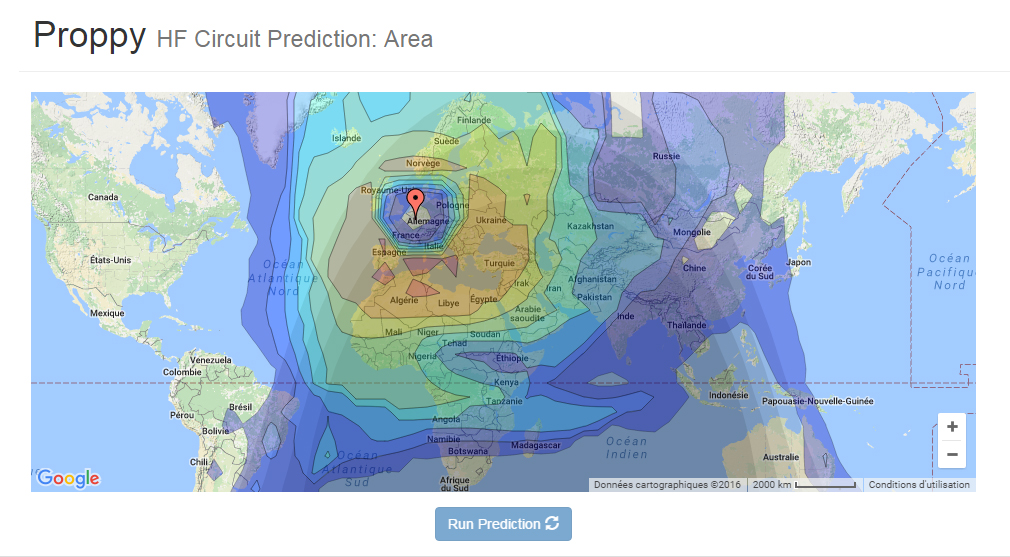
Proppy
- VOACAP
Online - VOACAP -
HFWin32 - ICEPAC - MultiProp - VOAProp
- DXAtlas
- Ham CAP
ACE-HF
Pro - WinCAP Wizard - GeoAlert-Extreme
Wizard - DXLab Suite - PropMan-2000
- IONPAC - IONPRED
|
|


M0DNS/HZ1JW
Online, freeware
2016
|
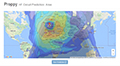
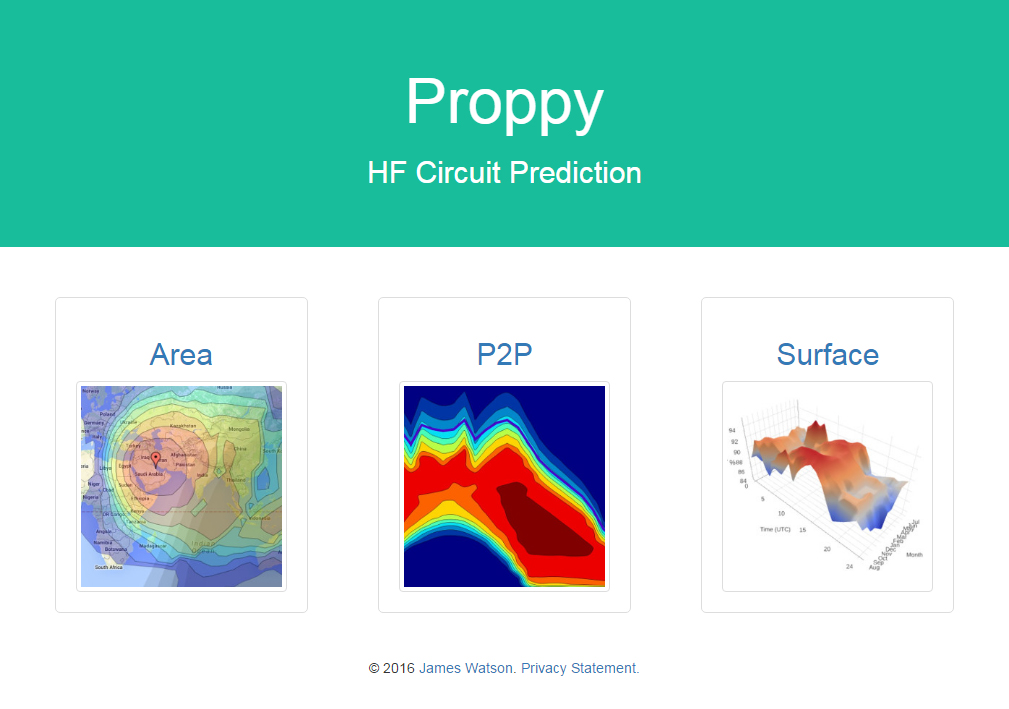
Proppy
Proppy
is a web application distributed and maintained by James
Watson (M0DNS/HZ1JW), responsible for porting the VOACAP Fortran code from the Salford to the
GCC compiler. It is in a relatively
early stage of development (2016) and will be improved in the future. The name
is derived from "Propagation Python" (Proppy).
Using
a web interface similar to VOACAP Online but simpler, it differs
from this latter by using the ITURHFProp prediction model (formely
REC533)
to calculate performances of HF circuits in accordance with Recommendation ITU-R
P.533-13) provided by the ITU. The P.533 library is thus a
separate application to VOACAP but unlike VOACAP, P.533 is well
documented and actively maintained by a professionnal body. The
ITRHFProp codebase is currently closed source although comprehensive
details of the algorithm are available on ITU website. Proppy
is thus an alternative to VOACAP.
Proppy
is more accurate than VOACAP when benchmarked
against the D1
databank as it uses an entirely different method of prediction.
The D1 dataset is an industry standard for evaluating propagation
prediction applications based on ITU-R P.1148-1
describing how prediction tools may be compared in a systematic
manner. Using this method, the standard deviation of error when predicting values with
VOACAP is 19 dB, P.533 reports a 10 dB improvement in the error.
Proppy is able to calculate path
lengths up to 7000 km, and beyond 9000 km using an empirical formulation
based on the range defined by LUF and MUF. It is assumed to be along the
great circle in E modes up to 4000 km and via F2 modes for all distances
and specially the longest.
The
engine takes into account all the usual parameters : MUF, time
windows (currently limited to any month in the current and next
year), location, power, SSN (Smoothed-Sunspot Number from SIDC), the field
strength i.e. the transmitter frequency, power and antenna gain,
required S/N, amplitude, etc. The model also calculates the
equatorial scattering of HF signals.
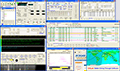
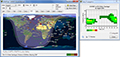
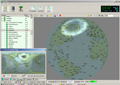
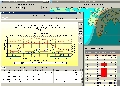
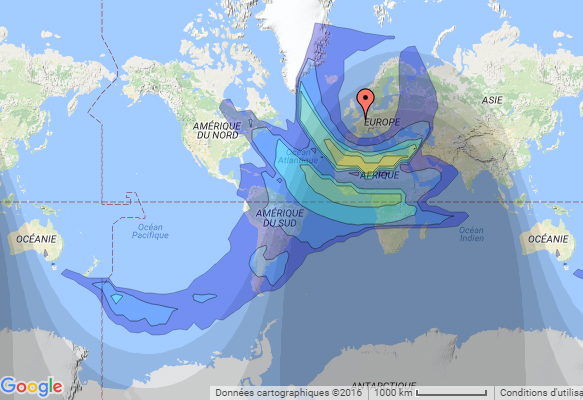
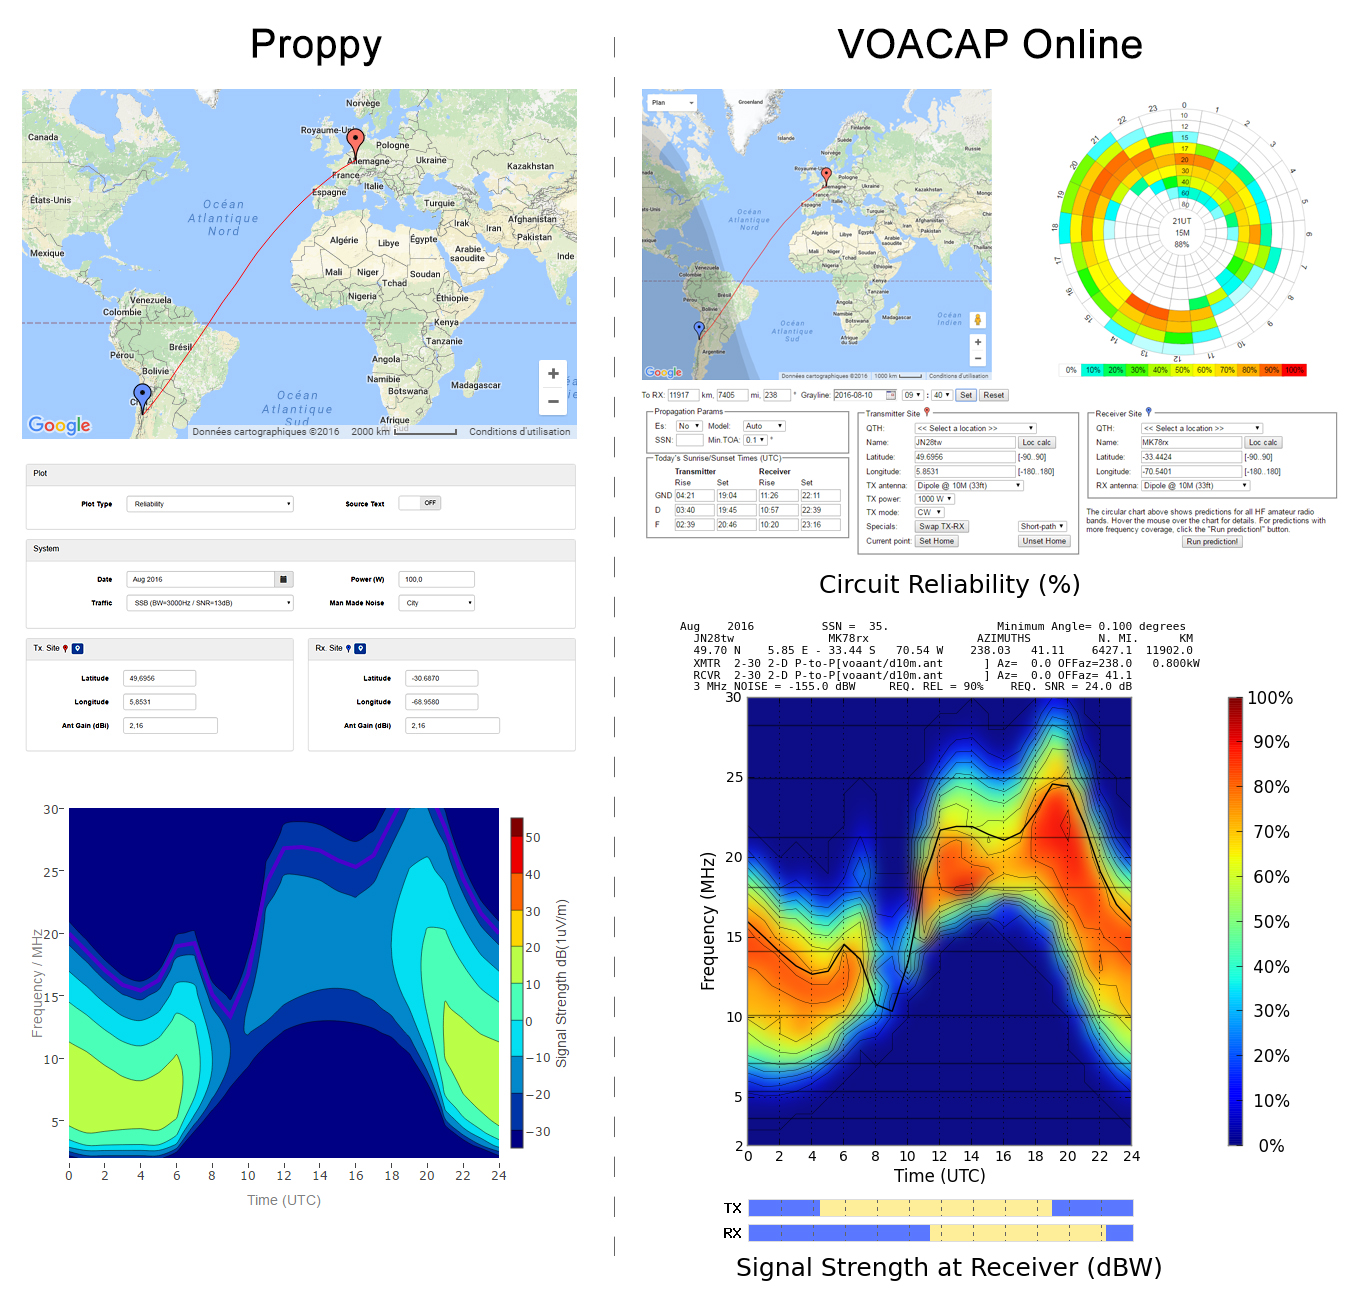
The
graphic interface provides three modes of calculation : Area
(displaying the Reliability, SNR or the Signal strength over the
world map), P2P (Point to Point, i.e. from one station to another)
and Surface Plot (a 3D point to point plot). The selection
of a location in Area and P2P modules is displayed over a Google map of the Earth but
does not accept Maidenhead grid square locator.
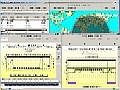
The
ouput in Area mode (2d and 3d screenshot from top left) can be displayed in low,
medium or high resolution (a bit slowest) and also displays
dynamically the signal strength (S values) when hovering the mouse
over the area. However, the steps of the zoom cannot be set at will
(but cannot be modified as they depends on Google's API). The Google's
world map window is also fixed and
cannot be expanded. This issue will be adressed in a next release.
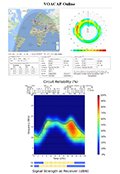
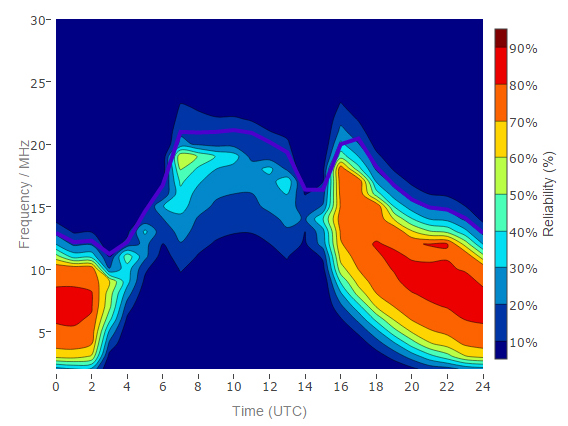
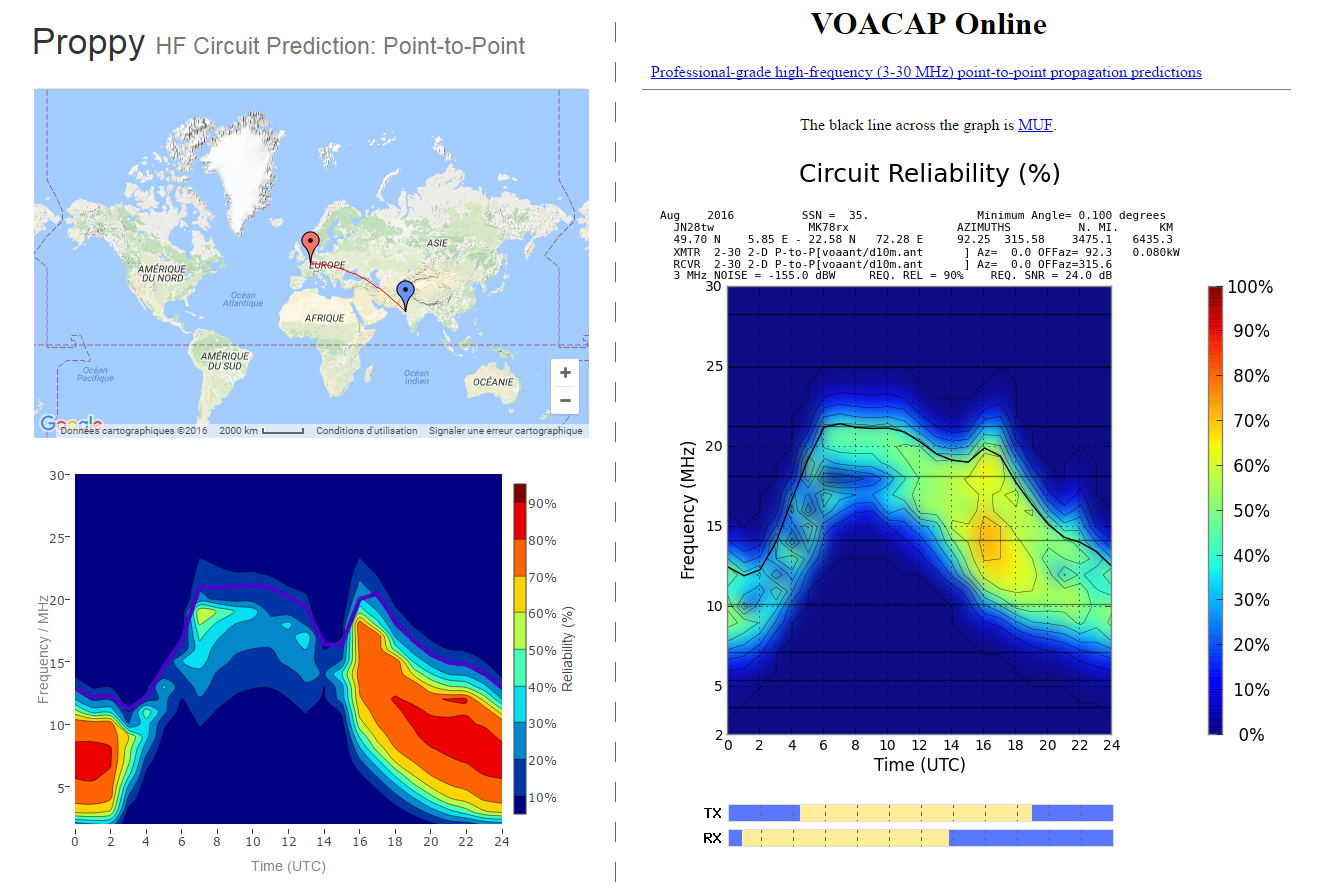
The output
P2P chart (4th screenshot from top left) shows a lower resolution
than the one of VOACAP Online (there are less intrermediate steps) but
its meaning is as easy to interpret.
Here a
first
and second
screenshot comparing P2P outputs from Proppy vs. VOACAP online.
The MUF (as the other data) can be different because the ITURHFProp model,
thresholds, required reliability and SNR used by Proppy are not the same as in
VOACAP. Poppy is more pessimistic (e.g. Proppy uses a SNR of 13 dB
for a 3 kHz bandwidth where VOACAP uses 8 dB for a 3 kHz bandwidth),
and data are derived from ITU-R F.240-7. In addition, circuits are
designed for the military use assuming the full 3 kHz bandwidth.
Future versions may extend this to 24 kHz bandwidth to support data.
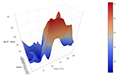
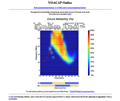
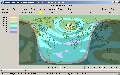
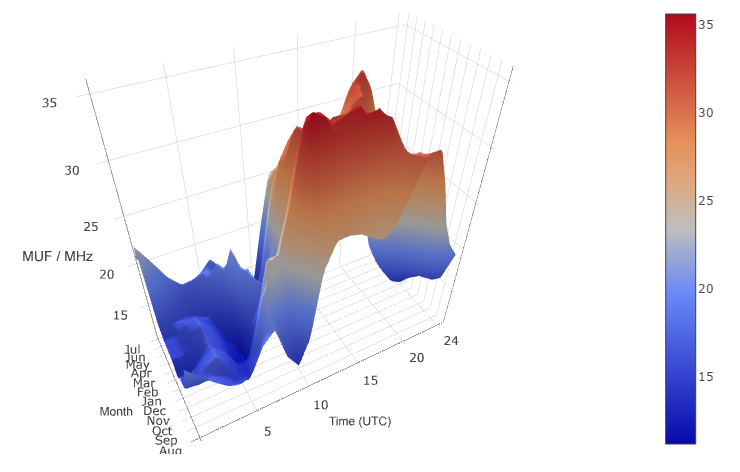
Then,
the Surface Plot (5th screenshot from top left) displays the P2P path as a
surface. This 3D rotatable vizualisation mode is nice but less easy
to interpret than the others nor very really useful.
Due
to a constraint of ITURHFProp, Proppy does not takes into account the possible Es mode nor the
takeoff angle of the antenna (inputs included in VOACAP Online). It includes only
4 types of antenna (isotropic, fan dipole 2-30 MHz, HR 4/4/.5 12
MHz, and Hex Beam 14.1 MHz) with the possible bearing. Additional
antenna designs will be added in a next release.
Output data can optionally be displayed using the external
Ploty application but the link to the worksheet is not automated.
For
all platforms. Requests for an active Internet connection.
Freeware.


|
|
OH6BG,HZ1JW,OH8GLV
Online,
freeware
2010-2015
|
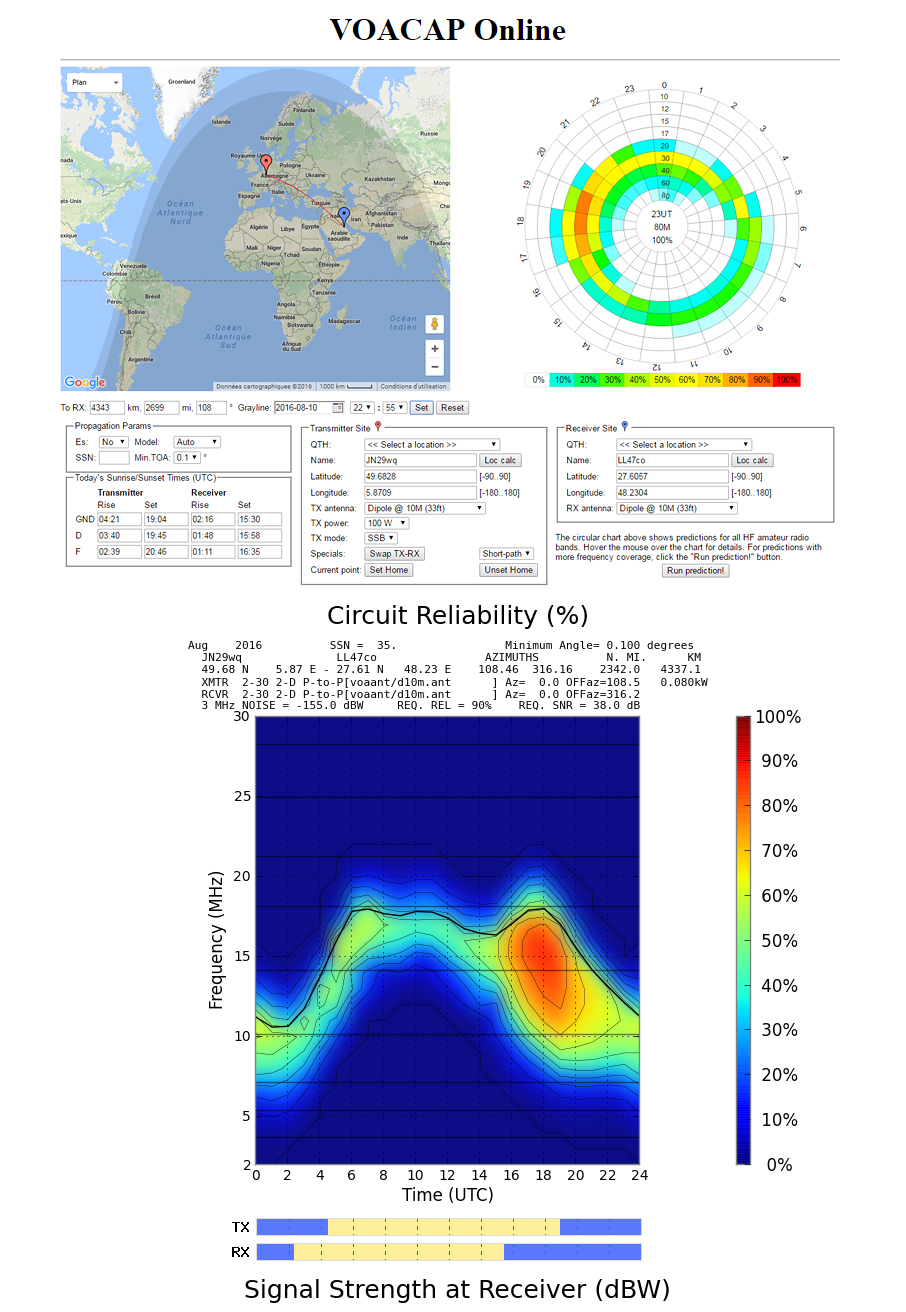
VOACAP
Online
VOACAP
Online was released in 2010. It has been developed by Jari Perkiömäki (OH6BG), James
Watson (M0DNS/HZ1JW) and Juho Juopperi (OH8GLV).
Available
for years as engine for other propagation prediction programs listed below,
with this version VOACAP it is now available free to all Internet users as an online service.
It was also added to DX Summit
cluster (when clicking on a call sign, you can select "Show
VOACAP Predictions").
As
explained in my review of VOACAP, this
engine uses ITS' IONCAP model and tens of prediction models. It is
the most accurate propagation prediction system available on the market
with over 50 years of radio propagation experience built in.
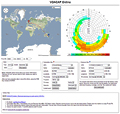
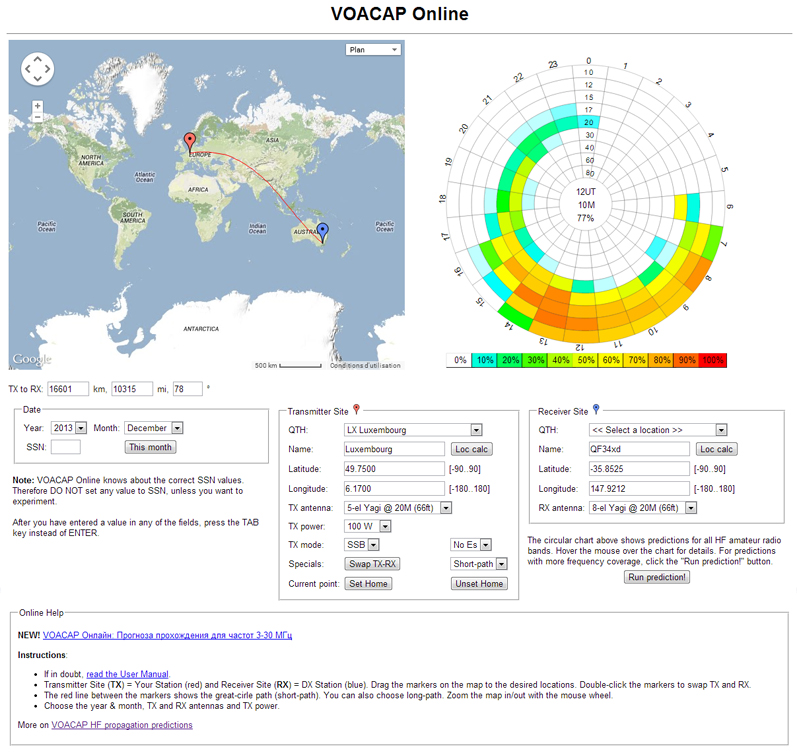
The
use of VOACAP Online web interface is very simple : you have to drag and drop the location (QTH)
of the Transmitter and Receiver (or you encode them) on a Google
map of the Earth, then select the time windows (day of the year),
and your field strength (antenna and power). Note that the system will
automatically take into account the Smoothed-Sunspot Number (SSN).
In fact,
VOACAP uses the SSN figures which are calculated monthly for many years
ahead by NOAA/NGDC as explained in the short history
of the Smoothed Sunspot Number and extrapolate future values.
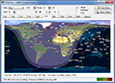
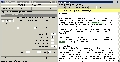
Based
on these data, the program displays immediately a colored
"pie-chart" showing the propagation probability (it is a
average) calculated for all bands over 24 hours (pie-chart at
right in the left screenshots).
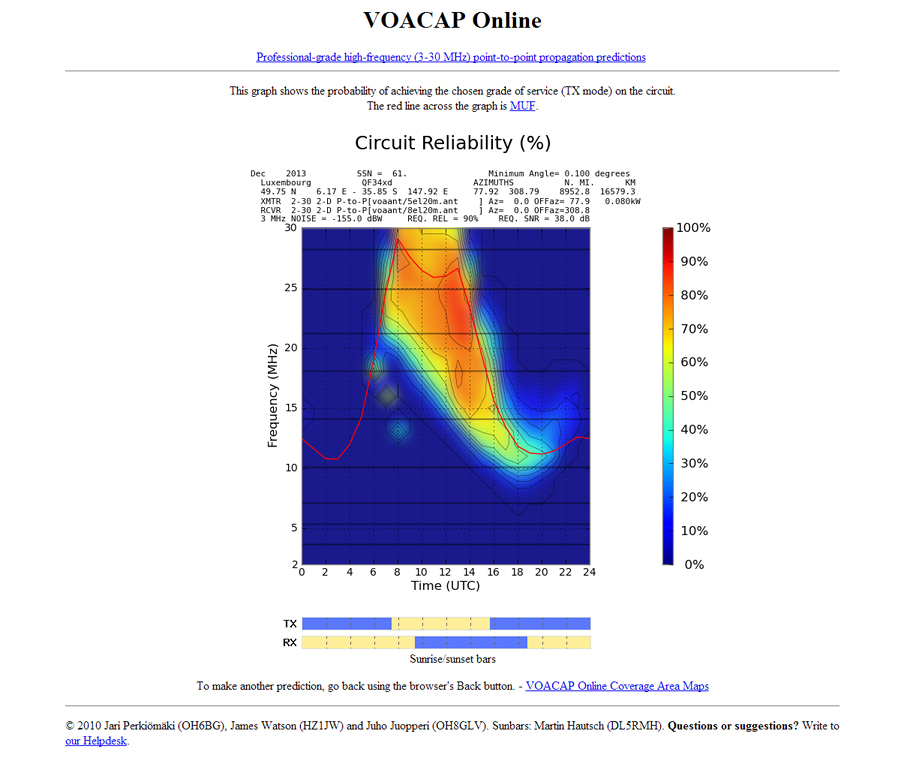
If
you press "Run prediction", a second page will open to display the
circuit reliability in a more standard way, in a time vs.frequency
chart with all circuit details for all HF bands (graphs with the
deep blue background at left).
You can also experiment with different antennas,
transmitter power, reliability and SNR.
The
VOACAP website provides an
illustrated Quick guide, many links and information about the VOACAP engine,
including support.
A
blog has also been created on which you will find since 2013 the User
manual and other information.
VOACAP
Online requires a web browser and an active Internet connexion. It runs on all platforms.
Note
that DX Summit cluster
refers to this program and displays a prediction
chart when you clic on a call sign (select Show VOACAP
Predictions)
For
all platforms. Requests for an active Internet connection.
Freeware.

|
|
NTIA/ITS
Freeware
1993-2005
|
VOACAP
It
is an enhanced
IONCAP model which methodology was modified by USIA/VOA
to be used for broadcast relay station design and antenna
specification. Most
ionospheric functions were devised and corrected by George Lane of
VOA.
The model was then completed and freely
distributed at the Ionospheric Effects Symposium in May 1993. To
enhance the user interface VOA funded the
NTIA/ITS after
Frank Rhodes from the U.S. Naval Research Laboratory enhanced the model.
The last implementations including the VOAAREA module where made by Gregory
R.Hand from ITS who maintains currently the product until 2005. There
is however no plans to modify VOACAP further.
A recently published U.S. Department of Defense ALE guidebook lists
VOACAP as the prediction model of choice and it remains today the
worldwide gold standard of propagation models.
Indeed, VOACAP
is the most powerful, flexible and complete product predicting the
ionospheric propagation (only HF) to date. Forecasts are
established only after have considered all a
communication circuit from the transmitter power and antenna gain to
the QRM at the receive location, what represents not less than 30
parameters to input. VOACAP can use different types of antennas
includes in the "Type 14" which contain gain/elevation
tables for a number of frequencies. However, these antennas files
are only suitable for modeling omni-directional as they assume that
the gain/elevation table is the same each each azimuth, what is a
gross over simplification when used with any directional antenna.
Complex to master at first sight,
VOACAP provides many functions taking into account the signal quality like the
circuit required reliability (SNRxx), the S/N reliability (SNR) and
tens of other parameters.
VOACAP
shows however some limitations. First, it works only with median
values like SSN and provide no real-time updates. It doesn't use A or K
index, and thus predictions do not take into account some important effects
like short-term disturbances or the aurora oval on short-wave
bending at high latitudes. It uses approximations for the F2-layer and calculating
the MUF. Its predictions must be interpreted with care at short-terms (e.g. set up the
reliability is mandatory) and are also almost useless for the top band because it ignores weather
influences, the sunrise/sunset effect and the gyro-frequency of
ionospheric electron (important near 1.8 MHz). In fact VOACAP is designed for automatic modeling
under normal, undisturbed conditions. Hopefully some
competitors using this engine are working on these improvements.
On
another side we must say that using median values like SSN can be
considered as an advantage as well. Indeed, the SNR
Distribution tables and Excess Gain tables that are internal to the
model were conceived and calibrated from many user reports against a
wide range of solar and geomagnetic conditions and at the higher
statistical levels (higher required reliabilities SNRxx). This is for
these reasons that any attempt to enter daily sunspot numbers for example
instead of the SSN can cause inaccuracies in VOACAP predictions.
VOACAP
has been released for all Windows platforms. The
latest version is "HFWIN32" (see above). The VOA FTP
website where the program could be downloaded is no more
available for years.
VOACAP
can be downloaded from Greg Hand's website
or from OH6BG's website who provides the complete
engine as well as a quick online guide. A more complete user
guide written by George Lane when is was under contract with Rockwell Collins is also available but it is very expensive ($60).
VOACAP
comes with ICEPAC and REC533 the two main models supported,
completed with VOAAREA, HFANT, S_I_VOACAP, and some additional tools. Read my review.
For
all Windows platforms.
Freeware. The last version is always supported on an email basis.
|
|
NTIA/ITS
Freeware
|
HFWin32
It
is the 32-bit version of the original VOACAP
model. It offers thus the same interface, same functionalities,
and show the same accuracy, and same limitations. It is
also provided with the same additional models (ICEPAC, REC533, VOAAREA,
HFANT, S_I_VOACAP, etc).
You
must use this version if you work on a Windows 32-bit platform and select one of the previous version only if you
are desperating to find the last version.
For
Windows 95/98/NT/2000/XP/ME. Read my
review of VOACAP.
Freeware. The last version is always supported by NTIA/ITS on an email basis.
|
|
NTIA/ITS
Freeware
|
ICEPAC
It
is
an enhanced
IONCAP model developed by
NTIA/ITS. It
shows thus the same
functionalities, accuracies and limitations as VOACAP
and shares the same data as well. Like VOACAP it is almost
useless to predict the propagation for the top band, or for a specific day of the month as it
works with median values only. However, using interpolations,
it can be used for hour-to-hour or day-to-day operations at the
condition as states the manual that "the user exercises his own engineering judgment in determining the
applicability and limitation of the results to specific
problems".
Conversely
to VOACAP, ICEPAC includes the ICED (ionospheric conductivity and electron density) profile model.
It is a statistical model that recognize the different physical
processes that exist in the large-scale features of the northern
hemisphere ionosphere. It contains for example distinct algorithms for the subauroral trough,
the equator-ward portion of the auroral zone, the polward region of
the auroral zone, and the polar cap.
ICEPAC
was no as extensively validated as VOACAP
and it doesn't take into account a smoothing function between
the hop and forward-scatter regions, a feature used in VOACAP.
Therefore, in some circumstances, ICEPAC shows
discontinuity of nearly 10 dB at mid-path, causing artificial
SNR losses exceeding 20 dB. On another side, ICEPAC
provides some additional iso-contours maps not available in
VOACAP like the SRNxx (Method 20). Results are more accurate
and the graph also more complete.
ICEPAC
is installed in the same time as VOACAP and other VOAAREA.
For
Windows 95/98/NT/2000/XP/ME. Freeware.
|
|
AA6YQ
Freeware
|
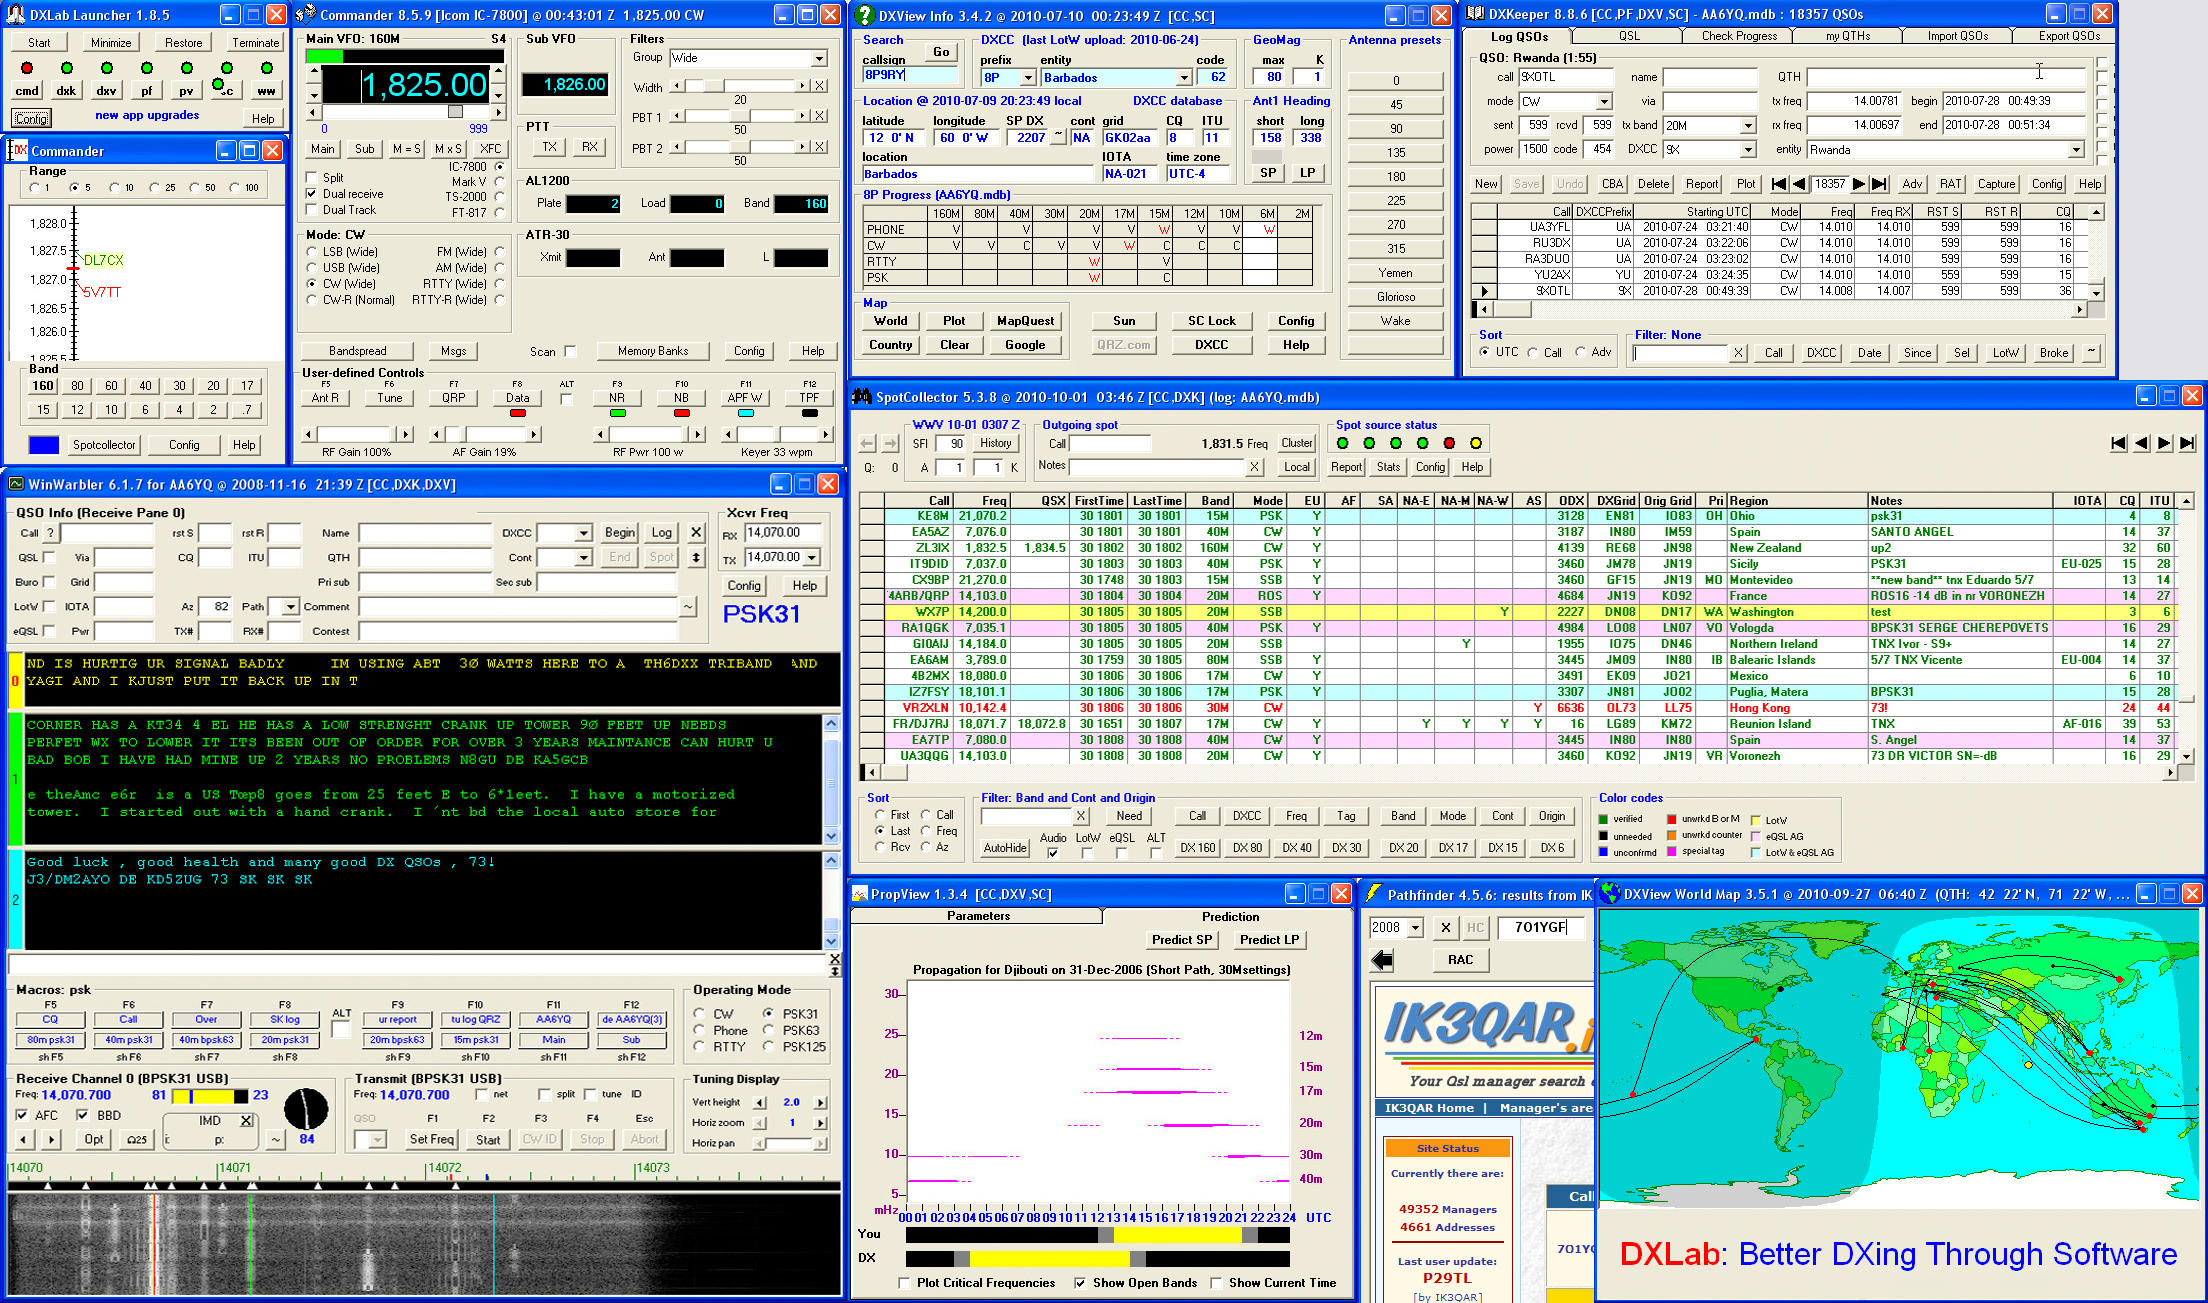
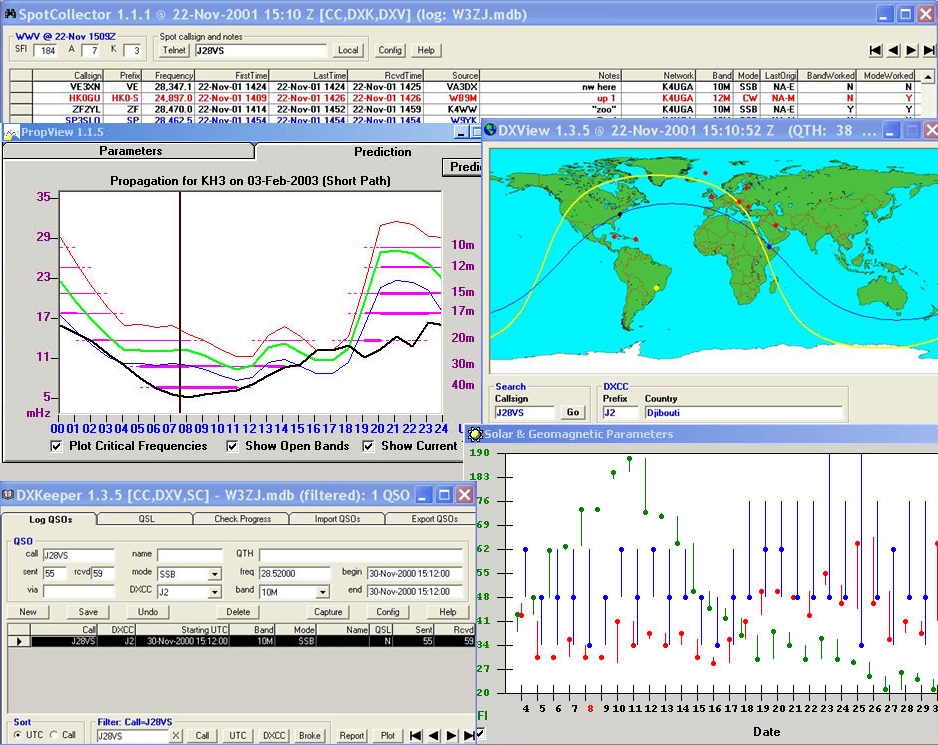
DXLab
Suite
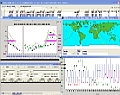
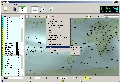
Written
by David Bernstein, AA6YQ, DXLab is a suite of interoperating applications constituted of
DXKeeper (the logger), DXView Info, DXView World Map, SpotCollector,
PropView, PathFinder, WinWarbler, Commander and Launcher. The
screenshot displayed upper left shows all modules launched.
The
PropView module use DXView to specify locations by pointing-and-clicking on a world map.
It
uses a reduced set of the IONCAP engine (see
below) to predict MUF and LUF along a single circuit. It downloads SFI, A- and K-indices from
up to 6 DX clusters thanks to SpotCollector module.
The target location can be specified
in several ways : by simply entering the DX station's call sign, by
clicking on an incoming DX spot, as well as by entering lat/long.,
entering a grid square, an IOTA tag, or clicking on a location on
the world map tat calls DXView. This latter module is
specialized in DXCC info, beam heading, sun position calculations
and is able to control antenna rotators. It also supports
"DX Atlas" by VE3NEA but does not share information with
it.
PropView
displays solar and geomagnetic curves over the last 30 days and shows
the bands open over a 24-hour period chart, with the option to
display critical frequencies. In addition the auroral oval is
displayed on a world map as a function of the K-index, along with
the strength of your signal what permits to estimate the likely
degree of auroral interaction. It displays also the solar terminator
and calculates sunrise/sunset times for any location over any 30-day
interval.
At last
the beacon functionality is not a simulation like do many other
programs. PropView controls your transceiver and QSY each time as
required to monitor each beacon in sequence, providing a very
accurate assessment of current propagation conditions.
Last
but not least DXLab can establish an arbitrary monitoring schedule
and rotate an antenna to follow that schedule.
Since
version 1.4.4, DXLab PropView module offers the option of using the ICEPAC or VOACAP programs
as "forecasting engines" as well as IONCAP.
Freeware.
For All Windows 32-bit platforms but ME.
|
|
AC6LA
Shareware, $39
|
MultiProp
This
is an impressive package that includes an very interesting propagation prediction program using together
the flexibility and power of MultiNEC,
an antenna modeling program and the VOACAP
engine.
Taking at best advantage of both
programs, its accuracy is similar to the one of these applications. However, using Excel
worksheets and macros, the encoding of all parameters of an antenna is complex and not easy to master in a few
keystrokes. To help you a free illustrated user manual is available in PDF format (62 pages very
well written that deserve a reading) of the author's website.
The
accuracy of radiation patterns calculated by the VOACAP engine are
limited to a grid size of 61x61 (vs. 361x361 for VOAAREA). But even
compared to results calculated at the same scale by VOAAREA,
MultiProp results show a lower resolution (by step of 12 dBW vs. 5
dBW in the iso-contour map, not important, a little more than 1
S-unit, but visible on the map).
Requests
MS-Excel (or Open office), MultiNEC and VOACAP.
Shareware.
For all Windows 32-bit platforms.
|
|
G4ILO
Freeware
|
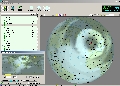
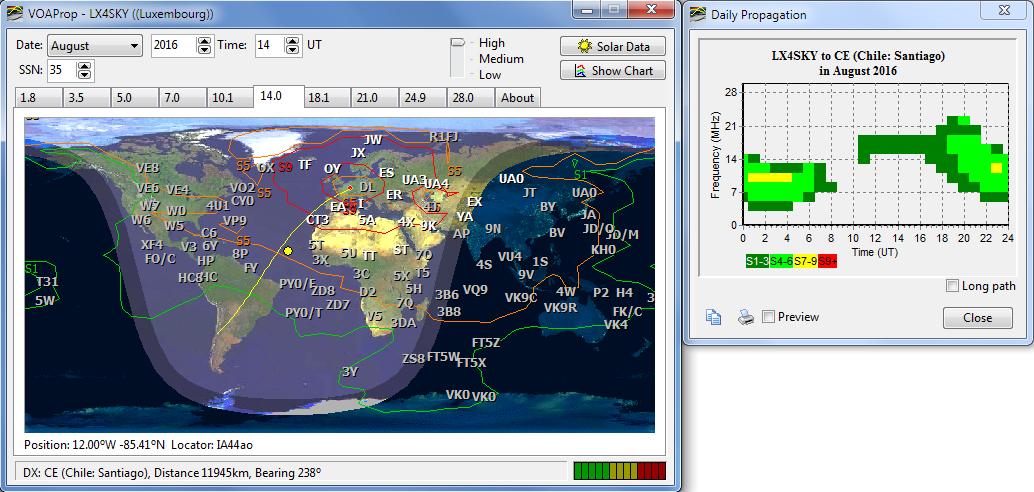
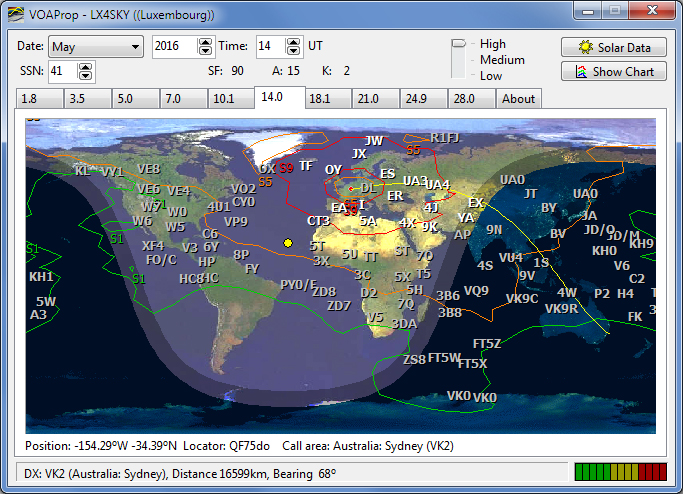
VOAProp
Developed
in 2002 by Julian Moss, G4ILO, the latest corrections where added in 2008
but there is no more support to expect from the author. This product
uses the VOACAP
engine and replaces
HPProp.
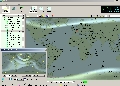
It uses the same user-friendly and minimalist GUI, displaying a
realistic world map showing even cities lights in the darkness
(compare the left screen dump to this satellite
picture).
The
screen is limited to a window of 683x494 pixels. A second small
window pops up when you request the MUF/LUF chart. This
very simple and light propagation program (~800 KB) takes into
account the solar flux or the smoothed sunspot number and planetary
indices. Interesting feature, when you type the SFI, the equivalent
SSN is displayed and vice versa, an option that I use regularly as a
"converter" to enter one or the other index in other
applications.
VOAProp
uses the VOACAP engine. It displays iso-contour frequency maps
on a gray-line cartesian world map, predict the DX activities for
each band, the F2 and E critical frequency, and MUF. In addition it
displays a MUF/LUF chart and the strength of you signal to the
receiver based of rough assumptions and statistical data.
The
version 1.1 released in 2008 is the latest. It also includes a connection to the
Internet (you can type any URL, for example to NOAA's WWV messages)
and an automatic updater to get current solar flux and K index.
Requests
VOACAP. Read also my review
of HFProp.
|
|
VE3NEA
Shareware,
$29.95
|
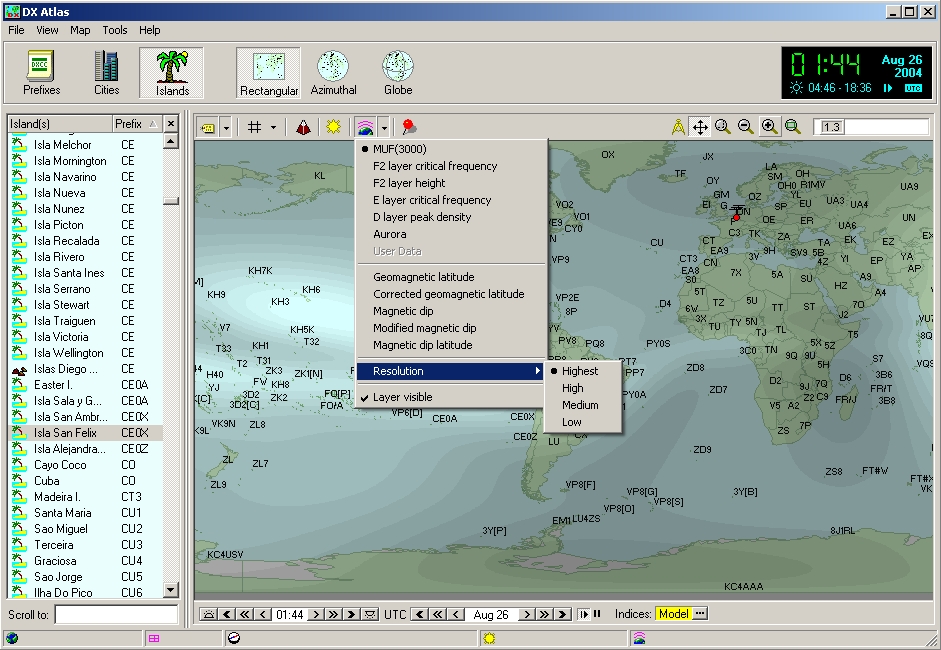
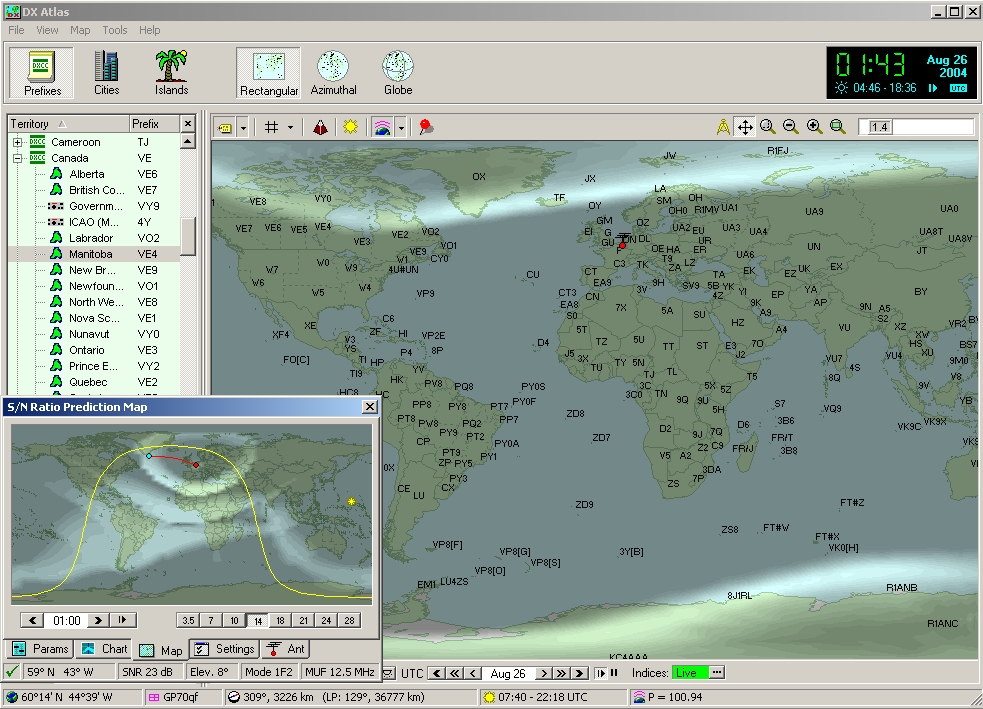
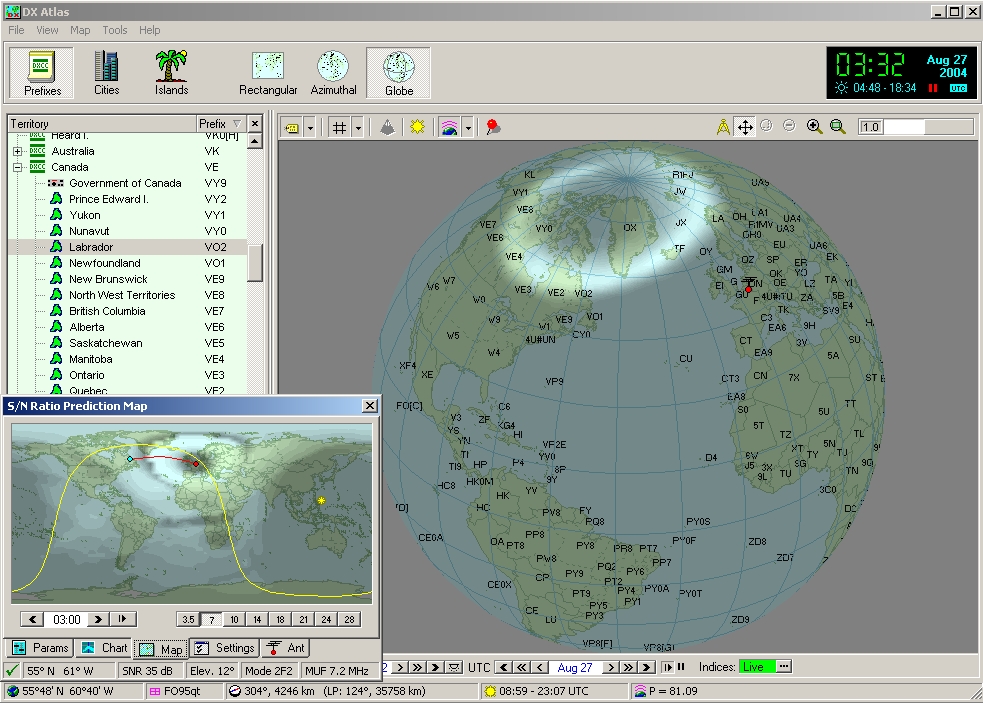
DXAtlas
DXAtlas
is often known for what it was in its first version, a superb geographical
atlas showing DX prefixes assigned to each entity and territory
completed with additional information (list of cities, islands, gray
line map, topographical map, pins, grid locator, etc).
From
version 2.24 released in 2004, Alex
Shovkoplyas, VE3NEA, interfaced this fine atlas with Ham CAP (see
below) to use the power of the VOACAP
engine and estime propagation conditions at a global scale. In option
it is also interfaced with IonoProbe,
a small tool monitoring in real-time space weather conditions. Each
of these products can run in stand-alone if necessary, but it is obviously by far preferable to use DXAtlas in conjunction with both
"add-ons"; it becomes then a very powerful tool.
Today, DXAtlas with Ham CAP and IonoProbe
is one
of the very seldom package to take advantage of the IRI-2001
ionospheric model, a long awaiting solution that is known
to provide accurate forecasts, of course in the limitations of the
VOACAP engine to handle global irregular variations in the ionosphere.
This
accuracy appears not only at long but also at short-terms as well.
In this configuration DXAtlas takes into account additional parameters and
models most of the time ignored by the other applications. DXAtlas
does not use Kp (or Q or the Storm model) but it does much better !
In tandem with IonoProbe, DXAtlas uses direct, real time ionosonde
measurements of the F layer critical frequency to produce real-time
ionospheric maps ! That means that instead of trying to guess how Kp
influences foF2 (Storm model), Alex just uses the foF2 itself, and
therefore DXAtlas is able to model ionospheric disturbances more
accurately.
DXAtlas
can
estimate the foF2 distribution and thus display the foF2 but also
the F2-layer height in km, the MUF, auroral oval (with the power
flux P in W/m2/sec), geomagnetic
storms,
D-layer peak density, geomagnetic latitude (normal and
corrected), and magnetic dip (normal, modified and latitude), all
this at four resolutions. In
addition, these ionospheric maps can be displayed in cartesian,
equi-distant (azimuthal) or spherical projection.
Parallel
to the "ionospheric mode", the standard operating mode of DXAtlas is always available
clicking on the menu icons; maps can be displayed with or without
prefixes or grid, you can zoom in the map (without interpolation) or
switch to the topographical map.
At
last, between us, know that Alex counts among the few experts who
have "put the finger" on some bugs or errors in the
IRI-2001 model and incorporated the fixes in DXAtlas... So, if you
need a quasi bug-free down-sized "IRI-2001compliant"
program, DXAtlas must be yours, Hi ! But of course it will never
help you to predict propagation conditions for a complete circuit. As it does not permit to access
to all output parameters of VOACAP, I had to remove its 5th star,
but I gave it another one for its accuracy in limitations of its
capabilities. Really, a must you if are serious in amateur radio !
Requires
Ham CAP and IonoProbe in option. For all Windows 32-bit platforms.
DXAtlas and
IonoProbe are shareware to register, respectively at $29.95 and
$20 with a 30-day-free-trial period.
|
|
VE3NEA
Freeware
|
Ham
CAP
This
program uses the VOACAP
engine and works optionally with DX
Atlas version 2.24 or higher and IonoProbe, both shareware also developed by
Alex Shovkoplyas, VE3NEA (see above).
When
we say that "small is beautiful", this expression might
apply to this point-to-point prediction tool that displays its
results in a small windows of 383x288 pixels.
The
main purpose of Ham Cap is to let the ham operator see at a glance the
trends of propagation while he or she is on the air, with a
minimal distraction from the transceiver.
Ham
CAP takes into account the smoothed sunspots number (SSN), and, like
VOACAP, doesn't use the geomagnetic indices by default. However the
K-index can be taken into account in option. Ham CAP requests also the date and month, home and target
locations, transmitter power, and antenna gain (15 models from the
isotropic to Yagi). A short engine permits to display the radiation
pattern of the selected antenna and see how change its radiation
pattern with the frequency, a very instructive feature using an
user-friendly GUI.
Results
are displayed either in a chart showing the S/N variation as a
function of time over the specified
path or on a global ionospheric world map, with the gray line and
the MUF in option. The signal strength can be displayed in a gray
scale, black and white or using pseudo-colors at three resolution levels. Working
with monthly values, that means that its algorithms use median
values only and its forecasts are thus more optimistic than the ones
provided by more complete software taking into account real-time
data or the circuit required reliability. However, it deserves a try
for its global ionospheric map, its antenna charts and its small size.
Freeware.
Requires VOACAP. For all Windows 32-bit platforms.
|
|
ACE-HF
License, $199
|
ACE-HF
Pro
ACE
stands for "Animated Communications Effectiveness",
a coverage display technique originally developed for U.S.
Navy submarine communications.
Written
for Windows 64-bit by Richard Buckner, this program uses GeoClock maps,
a format that has been choosen in order to match the displays with
ACE-VLF used by military clients.
ACE-HF
Pro uses the VOACAP
engine without modification of algorithms (thus with the same
accuracy and limitations), and can be interfaced with GeoClock and a logging
software. It can simultaneously calculate several circuits,
each using up to five antennas at each end of each circuit, an
option asked by contesters using "antenna farms" on
as many as five bands. Some data are extracted from
external files like antennas and locations that list 35000 cities world-wide
and calls several other programs. Representing about 50 MB on
disk, 500 files and 50 directories, it is thus not available for
demo purposes due to its size.
Its
main originality over all other VOACAP-based programs is to display animated circuit graphs of SNR, reliability,
required power gain, takeoff angle and signal strength. To achieve this,
ACE-HF Pro employs cubic spline interpolation to produce chart values at five-minute
intervals in order to better describe what happens in the real world.
Of course these intermediate values show less precision that hourly predictions.
Several charts can also be displayed, to name the MUF (with
HPF and FOT), Best Frequency, and an SNR or reliability summary chart.
The
input screens have been redesigned since version 1.0 and look great
even if they show some "adaptations" due to the underlying
Delphi engine that scales differently according to resolutions and
operating systems. The world map is fully graphical,
using EGA or BMP image which colors are a little too bright due to
the use of GeoClock, ACE' standard interface.
Among
additional tools, ACE-HF provides HFANT to model antennas, a
beacon monitoring showing the strength of their signal and
reliability, and an interface for NEC-Win Plus from Arraysolutions.
The product in
without any doubt as powerful as its competitors and maybe more
flexible. Indeed, on request, right-clicking on the mouse most
parameters can be displayed in a pop-up window and changed without having to enter in
each submenu of the circuit or only partially.
The
program comes with an extended help file, very complete and sorted
by feature, but it is non contextual (you cannot press F1 and get
help on a field) and you need to browse the document to find a
specific item. It should be converted in Microsoft HLP format and
fully indexed to be really useful as not all users will take the
time to read its 46 pages, even if they are very educative and their
reading highly recommended. In this context the narrative mode can
help the casual amateur.
ACE-HF
Pro runs on all Windows 32-bit plateforms
and is now at version 2.04. It is provided on CD-ROM (with VOACAP)
and a 3.5" floppy disk containing the transmitter location file
(your license) that will be copied onto disk during the install
procedure.
Compared to
equivalent functions available to its competitors and its GUI, in my
humble opinion the high price of ACE-HF Pro is no more
justified, but exceptionally it keeps its four stars for its
excellent animation using GeoClock map, and the great number of
users, most professionals that trust in this product and the other
prediction programs released by the publisher.
No demo
available due to its size. However, an extensive "Take the tour"
section is provided on the website as well as free and very instructive propagation
tutorials written by Dick Buckner and George Lane.
License.
Comes with VOACAP. For all Windows 64-bit platforms and mobiles. An upgrade from old
32-bit versions is available for $99.
|
|
Kangaroo
Tabor Soft.
License,
$50
|
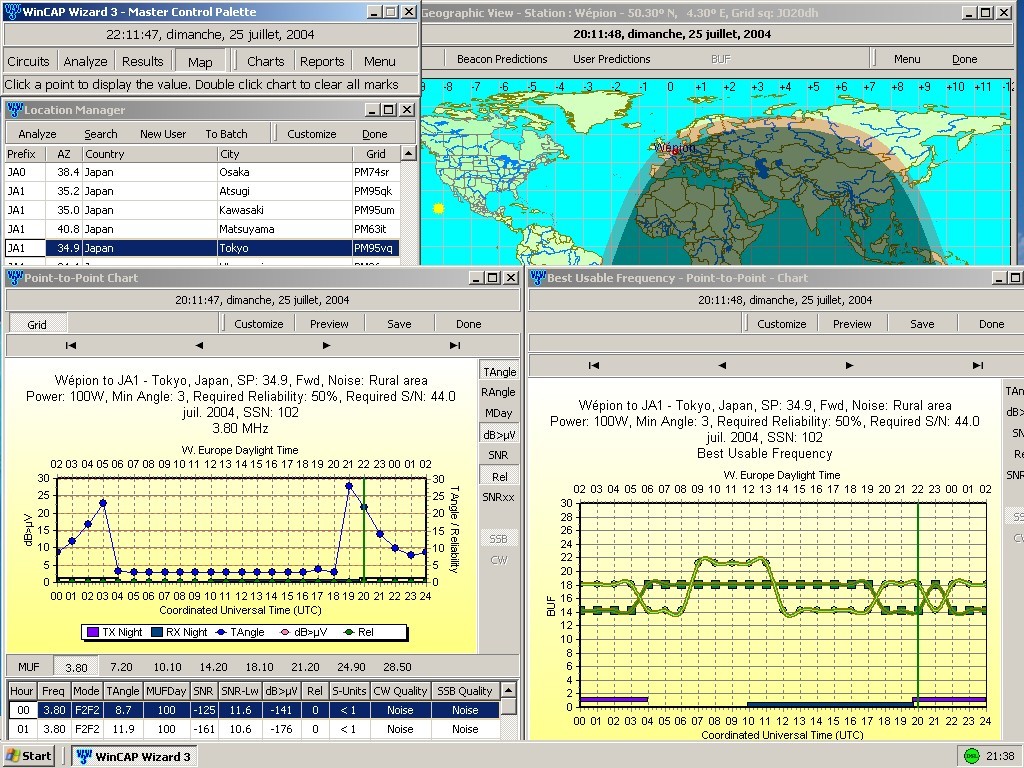
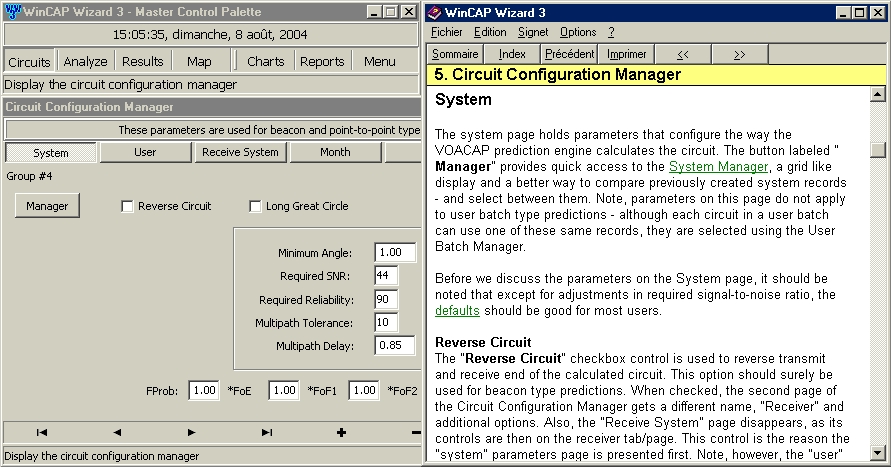
WinCAP
Wizard
It
is a enhanced graphic user interface (windows) of the famous CAPMAN
which is no more supported.
WinCAP
Wizard doesn't use the IRI model but rather the VOACAP
engine, an improved IONCAP model developed by VOA. Like most
VOACAP-based applications, it displays thus some approximations (F2, MUF, etc) and
ignores some parameters that affect propagation (no Kp-index thus neither the PCA or the
auroral oval is considered at high latitudes, nor magneto-ionic
effect, sunrise/sunset or weather conditions for the top band, etc).
This
is however a powerful and flexible tool but it requests some habits to be mastered (or to read
my introduction to
such models) due to its numerous settings. WinCAP provides
HFpropagation forecasts taking into account a complete circuit, and
even multiple circuits if necessary like all serious VOACAP-based
application.
Like
VOACAP there are not less than 30 inputs to set to get an accurate
forecast for a single point-to-point circuit. Hopefully, like in
VOACAP these inputs are grouped in several windows or groups
(System, User, Receive system, Month, SSN, Xmtr Antennas, and
Frequencies).
WinCAP
Wizard displays up to 7 charts partly customizable displaying MUF, Best
Frequency, TX
antenna takeoff angle, SNR, Reliability (SNRxx), and other signal strength at receive
location. It can
generate propagation charts or text reports for up to 18 locations anywhere in the
world simultaneously (circuits). Its user batch manager permits also
to replicate in one pass a modification common to various circuits. All windows are static excepting
the world map on which you can clic to get a point-to-point
prediction This map is also used to display NCDXF/IARU beacons and their
relative power.
The new version
5 includes "smart
charts" and other quick chart to display propagation of beacons.
Today
WinCAP Wizard comes free with GeoAlert-Extreme Wizard (see
above) and Beacom-Time
Wizard that complete the program with very interesting dynamic
features.
Requires
VOACAP (provided with the product if necessary) and an active Internet connexion if GeoAlert-Extreme Wizard
is installed.
For
all Windows 32-bit platforms. Read my review.
License
or QSL-ware. Today at version 4.1. 60-day-fully-functional free trial.
With
the passing of Jim Tabor in 2010, Taborsoft products are no
longer supported.
|
|
Kangaroo
Tabor Soft.
License,
$20
|
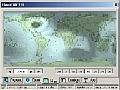
GeoAlert-Extreme
Wizard
The
first version of this program was released in 2004 and replaced GeoAlert Wizard.
In
the line of its predecessor, it displays updated
geophysical indices in a dashboard (showing SSN, SFI, Kp, Ap, solar
wind Bz component, pressure, speed, etc) and various user-friendly
charts related to solar and geomagnetic indices extending up to 24 years.
This
program is stand-alone but requests the VOACAP
engine and a Internet
connexion to get online updates. It can be interfaced and comes free
with WinCAP
Wizard 3 or higher (see below).
Unlike
the previous version, this
new version takes advantage of the power and accuracy of VOACAP to
display a world map showing the ionosphere status at earth scale,
the MUF, rather than a point-to-point prediction. Its
"Squares" option is a major improvement over the previous
release. It is very powerful but at first run (and only once) it
requests over 30 minutes to calculate all predictions on a 1 GHz
computer. Why so long ? Because it generates a world map valid for
all a month and all hours and take into account a possible zoom in
the map. You must see it to believe it !
This
map can be displayed in various forms (overview in blue scale at
various resolution, colored per amateur band or for contest purposes).
Its resolution changes according your amplification (zoom) factor,
placing W6ELPro, Ham CAP, HFProp and other applications showing the
same map now far behind its
performances.
This application is first designed to get an overview of
propagation. You cannot for example get the SNR or dBW on a target
location clicking on the map yet. Therefore I don't give it four
stars. But Jim is working on other
products that will probably support this feature and many others.
Requires
VOACAP and an active Internet connexion. For
all Windows 32-bit platforms.
License
or QSL-ware. Today at version 3.3.25. 60-day-fully-functional
trial. Comes free with WinCAP
Wizard.
With
the passing of Jim Tabor in 2010, Taborsoft products are no
longer supported.
|
|
Rockwell Collins
License,
$99
|
PropMan-2000
Ionospheric
prediction program based on the VOACAP
engine. It has been developed for the U.S. Government and can be
interfaced with various external communication devices, most
property of the Army.
However, this application doesn't provide better predictions than the
original VOACAP and it is much more expensive and less
flexible than its competitors. Therefore I removed it one star for its untenable
marketing position.
Requires VOACAP. For
Windows 95/98/NT. Demo available
|
|
|
VOACAP
Origins
|
|

George
Lane and al.
No
longer supported
|
IONCAP
This
is the first professional ionospheric signal model down-sized for personal
computers. It is based of HF ionospheric studies made between 1975
and 1978 by John Lloyd, George Haydon and Donald Lucas who developed
an interface for the Army called the "Ionospheric Communications Analysis and Prediction"
program, IONCAP for short.
In 1983,
George Lane then Teters and al. from the
Voice of America modified the code for the broadcasting needs of VOA
(see VOACAP
above).
IONCAP
uses a F-layer algorithm, has methods for calculating MUFs, and it
deals with the range of values of critical frequencies resulting
from the statistical variations in the sounding CCIR data.
IONCAP
program has many other methods beside FOT-MUF-HPF and some give
long-term availability figures, the fraction of a month the path
would be open, as well as the S/N ratio and reliability. Thus, in
contrast to Fricker's method which is based only on F-region
considerations, IONCAP deals with fluctuations of signal strength, a
D-region factor, as well as man-made noise.
IONCAP
is no more supported as it "mutated" in VOACAP and ICEPAC.

|
|
Raymond Fricker
No
longer supported
|
IONPRED
In
the '80s Raymond Fricker from the BBC Worldservice created this
complex propagation program that included a new scheme of hop-testing. Essentially, the program
looked at each hop in detail, at the points where the E-layer is
crossed and at the highest point where the critical frequency of the
F-region is important. So the hop-testing involves determining
whether the mode is reliable by seeing if operating frequency is
above or below the E-cutoff frequency by 5% and less than the
critical frequency for F-region propagation by 5%.
With
an initial choice of radiation angle, the path structure can be
sorted according to E- and F-hops, depending on the outcome of the
tests along the way. Fricker also adjusted the height of the
F-region according to local time so hop lengths are not constant
along a path. As a result, the path could over- or under-shoot the
target QTH. If the error is more than 25 km, another radiation angle
is chosen and the process starts again.
IONPRED
also calculates the ionospheric absorption expressed in dB, and adds that to
the signal loss due to spatial spreading or attenuation and ground
reflections.
At last IONPRED uses the availability of the path, the number of days
of the month that it would be open for reliable communication (a
kind of FOT-MUF-HPF). The number of days is treated as a continuous
variable in contrast to the upper or lower decile approach with the
FOT-MUF-HPF method.
However, in the '80s Fricker's method was time-consuming, to say the
least.
|
Back
to Menu
|


