LRGB
and dithering techniques
Contents:
LRGB technique
Dithering technique
L2RGB
technique
The basic function of a dispersive spectrograph is to sample the spectrum with many distinct detectors. Consider a Kodak KAF-0400 CCD. In the present case there are 768 pixels according to the direction of the spectrum and consequently one thus says that the spectrum is sampled by 768 spectral channels.
By considering these definitions, it appears that the images realized by tricolors method are comparable to a spectrograph in which the number of spectral channels is limited to 3. So, the spectral resolution is very weak. The typical bandwidth of a colored RGB filter is typically 1000 A, which gives a resolution power of R=5000/1000=5. It is however sufficient to make good physics.
Good visualization of data is an essential step for interpretation. So, we describe here a popular technique, LRGB method, which appreciably improve appearance of "true color" images.
It is first of all necessary to obtain three images carried out through filters R (red), G (Green) and B (Blue) which have if possible a high signal-to-noise ratio (S/N ratio or SNR). On the other hand these images can not have an excellent spatially resolution (typically images obtained in binning 2x2 mode in order to increase the SNR). The principle is to combine (i.e. merge) with RGB images a new image which has a high spatial resolution (very good seeing and/or binning 1x1 or use of a large instrument or application of the drizzling technique, see below). This image, namely L for Luminance, is normally an image carried out in broad spectral band (grey scale image or white image), generally with no spectral filtration (but if you make images with dioptric objectives, IR blocking filter will remain probably necessary). Another strategy consist to add all separate R, G & B frames in the one high signal-to-noise ratio L image.
The final image (LRGB) associates the point like aspect of the L image with the high SNR color contents of the RGB images. The result is a more esthetic image and especially, containing appreciably more useful information. It is significant to note that the weak resolution of RGB images has a weak apparent impact on final LRGB composite.
Before being able to combine the images L, R, G and B it is necessary to carry out calibrations. It is important first to have correct R to G to B ratios to represent natural images (color balancing). One needs also a same scale for the images L, R, G, B and a precise registration between these components. All this can be done with your favorite image processing software. Under Iris software you can use the SCALECOLOR and COREGISTER commands for example (click here and here for details).
A key technique for combination of the LRGB components is to convert the traditional RGB representation of the true color image to the HSI space (Hue, Saturation, Intensity space). This convertion produce three images. The hue image correspond to the dominant colors (color tone), the saturation image correspond to the purity of colors and the intensity correspond to the magnitude of the signal in the colored image.
More precisely:
I) In the hue image, pixels that are predominantly red in the trichromatic image will be represented by high levels, pixels that are predominantly green will be represented by intermediate levels, and pixels that are predominantly blue will be represented by low intensity levels. If the levels are represented by the angles from 0° to 360°, red corresponds to 0°, green to 120°, blue to 240°, red again to 360°.
II) In the saturation image the areas of the tri-colors image where the colors are purest will be represented by the high levels. Low saturation results in a gray aspect images, middle saturation produces pastels and high saturation results in vivid colors.
III) The intensity image is the one that most resembles each of the monochromatic components of the tri-colors image. This image expresses the average intensity of the three components in a gray scale.
Figure1. The coordinate system for HSI model is
cylindrical. The value of S is a ratio ranging from 0 to 1 on the
side of the color circle. A point at the apex (R=G=B=0) is black.
The point S=0 and I=1 (situated on the chromatic axis) is white.
Intermediate value values of I for S=0 are the grays. Note that
when S=0, the value of H is undefined. For exemple, pure red
is at H=0, S=1 and I=1, pure blue is has H=240°, S=1 and I=1.
So, changing H corresponds to selecting a pure color than S=I=1.
Adding white color to a pure color correspond to decreasing S without
changing I. Tones are created by decreasing both S and I. Shades
are created by decreasing I and fixing S at unity.
Colorimetric transformation is a
powerful tool that can profoundly modify the appearance of color
images. In particular, the HSI representation is often used
in science to enhance specific colored details in an image. If they
are properly used, transformations between the HSI and the RGB systems
allow you to reveal subtle colored characteristics in images and
thus make them easier to interpret.
|
|
|
|
|
|
Figure
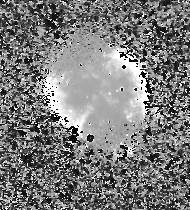
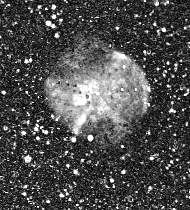
2. Upper line,
RGB components of planetary nebulae M27. Lower line, HSI components.
Processed with the RGB2HSI command of Iris software
(click here for description of a graphical version of this
command).
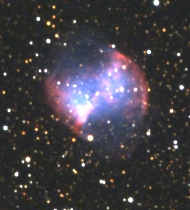
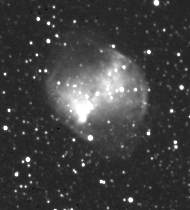
Figure 3. Standard tricolor image of
M27 (Takasahi Epsilon 160 telescope + KAF-0400). Processed by Iris.
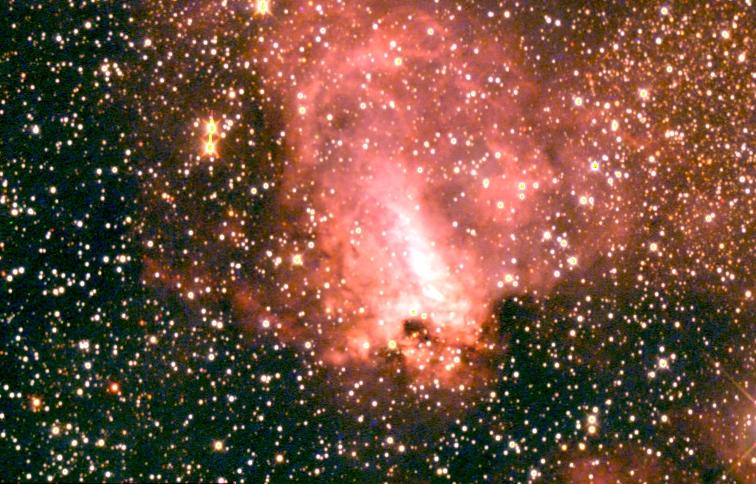
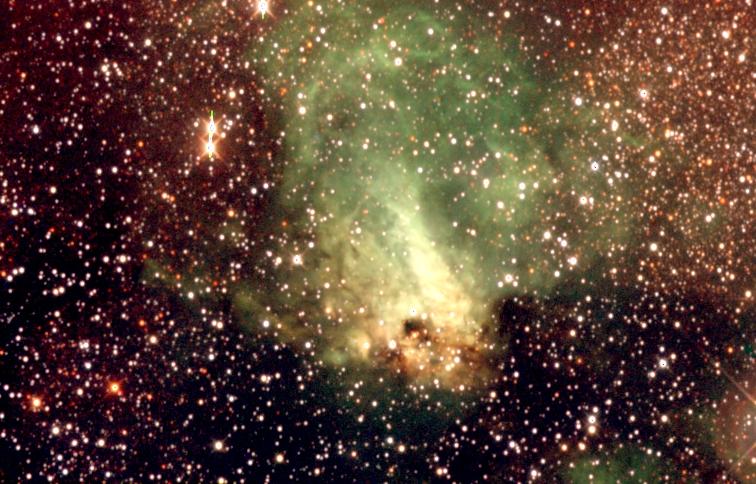
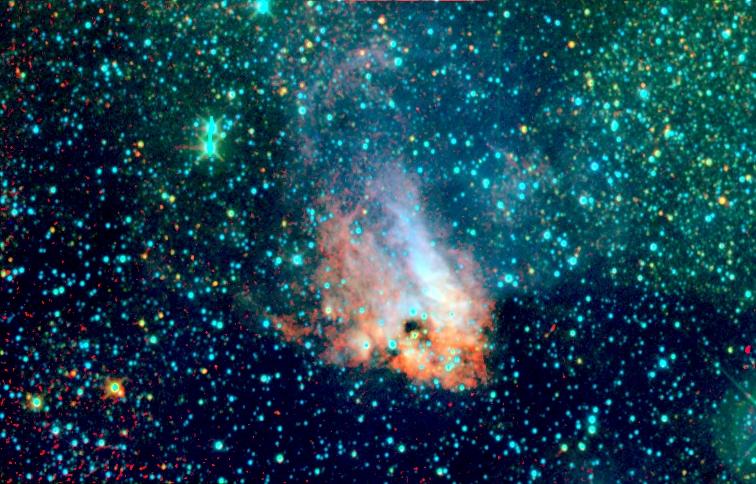
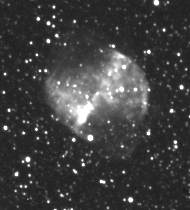
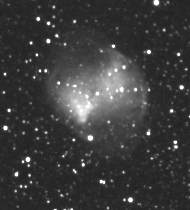
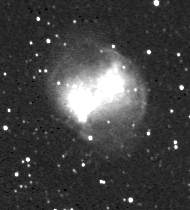
Figure 4. It is perfectly possible
to choose particular combinations of filters to generate the tricolor
image. Here is an example for M17 nebula (Epsilon 160 telescope,
KAF-0400, 1x1 binning). Top, the traditional true color RGB combination
(or RVB). Middle, IRG combination (I for Infrared spectral band).
The colors are not natural ("false true color images")
but reveal the areas with strong IR emission (the G band is coded
in blue, R band in green, I band in red ). Bottom, ZRG combination
(Z = far infrared band, near 1 micron, selected by a RG1000 filter).
In this last image, the IR parts (coded in red) are particularly
quite visible. We are at the edge of infrared astronomy !
My combination of Schott glass for the BVRIZ spectral bands is the following (photometric studies quality):
* B band : BG12 (1 mm) + CG385
(2 mm) + BG18 (1 mm)
* V (or G) band : GG495 (2 mm) + BG 18
(2 mm) + WG305 (1 mm)
* R band : OG570 (2 mm) + KG3 (2 mm)
* I band : RG9 (3 mm) + WG305 (1 mm)
* Z band : RG1000
(3 mm) + WG305 (1 mm)