|
1. INTRODUCTION
The transit of Venus against the Sun on June 8, 2004, was a long-awaited event, which was observed by thousands
of amateur and professional astronomers around the world. Many of them reported having seen the "black drop
effect," while others did not see it and still consider it is an optical illusion related to the turbulence
of air and the quality of instruments. Others have also mistakenly thought that the black drop effect comes from
Venus'atmosphere. The existence of the black-drop effect as real and not resulting from Venus'atmosphere has been
shown, however, by such authors as Pasachoff, Schneider, and Golub, 2004, with spacecraft observations of a transit
of Mercury.
This paper reports on the observations and photographs taken by members of the Amateur Astronomy Clubs of Dorval
and Montreal during the transit of Venus at contact III (the only one visible in Montreal), and proposes an original
and detailed interpretation of the black drop effect.
2. INSTRUMENTATION
AND IMAGE TREATMENT
Several amateur telescopes were used in Montreal to visually observe the transit of Venus or take photographs of
it (3 Schmidt-Cassegrains of 5-, 8- and 11-inch, 2 refractors of 3- and 4-inch, 2 Maksutovs of 5- and 6-inch in
diameter).
The photographs reproduced in this report were taken by André Gendron and Gilles Guignier. Photographs taken
from NASA's satellite TRACE ("Transition Region and Coronal Explorer") with a telescope of 12- inch in
diameter, and available from the Website of Pasachoff et al. (http://www.transitofvenus.info), were also examined
for comparison, with permission of the authors.
The telescope of A. Gendron was an 11-inch Celestron C11 Schmidt-Cassegrain equipped with a Thousand Oaks solar
filter, Feather Touch micro-focuser, Vixen camera with T-ring adapter, Varigami and EQ-6 mount with Model MTS-3
Bodoefer-Elextronix system. Photographs were taken at primary focus with Kodak ISO 200 photographic film at 1/8
to 1/15 sec.
The telescope of G. Guignier was an 8-inch Celestron C8 Schmidt-Cassegrain equipped with a Baader AstroSolar filter,
VestaPro PCVC680K webcam camera and Astronomik IR-Block filter. The images were taken at f/10 primary focus and
processed using Christian Buil's Iris software. Typical processing consisted in extracting series of 30 to 100
black and white images from 180-sec AVI videos recorded at 10 frames per second. Then the images were corrected
by subtracting a reference offset image and divided by a reference flat image. Finally, selected frames were registered,
accumulated and enhanced with an un-sharp mask. Images were then exported in FITS or JPEG formats.
The size of the disks and halos around Venus and the Sun in the photographs was deduced from the magnification
factor of the telescope and the dimensions of the photographic film or camera pixels used. To detect precisely
the edges of Venus and the Sun, Richard Berry's AIP W4 software, Frei & Chen's algorithm and the Pixel Radius
Tool were used by A. Gendron and G. St-Onge. The uncertainty on dimension measurements was ± 1 pixel, which
corresponds to ± 1.4, ± 0.4 and ± 0.3 arcseconds in the photographs by A. Gendron, G. Guignier
and TRACE, respectively.
The actual diameter of Venus on June 8 (58.2 arcseconds) was obtained from the Observer's Handbook for the Year
2004.
A likely cause for the halos is the "blurring" of the images by the telescopes, also described by Pasachoff
and Schneider (2004) as the "point spread function (PSF)" of the telescopes, or the "contrast resolution"
of the telescopes described by the "modulation transfer function (MTF)" or "phase transfer function
(PTF)" in other publications. The frequency cutoff of the telescopes was measured by A. Gendron, using a "target"
developed by M. Koren and available on the web (see references). This target consists in a series of parallel,
vertical black and white bars or lines of widths decreasing logarithmically from 2 to 200 lines per millimetre,
and further divided into 6 zones of different contrasts.
This target was printed by A. Gendron
into a length of 25.1 cm, mounted on a foam board and placed at a distance of 51 times the focal length of the
11-in and 8-in telescopes, i.e, 142.5 and 103.6 metres, respectively. Photographs of the target were taken with
the telescopes under conditions similar to those used during the transit of Venus. Details of the calculations
can be found on the Dorval website. Plots of line intensity vs. line frequency (in lines/mm) and of frequency modulation
vs. linear frequency allowed to determine the frequency loss and the angular resolution, which can be used to quantitatively
describe the resolution of the telescopes, in arcseconds. Results are indicated in Table 1.
TABLE
1
Resolution of the 11-in and 8-in telescopes
|
Telescope size,
in inches
|
Authors
|
Frequency loss,
in lines/mm
|
Angular resolution,
in arcseconds
|
|
11
|
A. Gendron
|
9
|
~ 8.2
|
|
8
|
G. Guignier
|
53
|
~ 1.9
|
In addition, it could be shown that
the resolution of the 8-in telescope was limited mainly by the size and arrangement of the camera pixels. The poor
resolution of the 11-in telescope was due to a collimation problem.
The PSF of the 8-in telescope was also measured by G. St-Onge, using images of the Epsilon Lyrae "double-double"
star with the telescope, and the MIPS and PRISM software. Details of the calculations are available on the Dorval
website . The PSF was thus found as ~ 1.75 arcseconds, which is in good agreement with the angular resolution measurement
of Table 1.
Note: strictly speaking PSF and MTF
are different, with PFS related to the spread of images and MTF to contrast resolution. However, since the measured
PSF and angular resolution values are both quite similar to the sizes of the observed halos, this suggests that
the halos are probably mainly related to the blurring or contrast resolution of the telescopes used.
To reveal more subtle differences in light densities in the photographs, software PRISM98 was used by G. St-Onge.
Using this image treatment, different light densities are attributed different colours. When looking at colour-treated
photographs, one should not forget, however, that:
- these are false arbitrary colours
- the small differences revealed by the colours are not visible in general in the untreated photographs or by visually
looking through the telescopes
- colours can be compared only in sets of photographs which have been subjected to the same image and colour treatment
and exposure time (e.g., in Figure 4). Colours in photographs taken from different instruments (e.g., Figure 4 and Figure 5), or taken by the same instrument and exposure time but treated differently
(e.g., Figure
3 and Figure 6), correspond to different light densities
and should not be compared directly.
The photographs by G. Guignier colour-treated by G. St-Onge were separated into 256 levels (8 bits) of light intensities
to measure the relative intensities at various locations of the photographs, on a scale of 0 to 256 (see Table
2).
3. RESULTS AND DISCUSSION
3.1. THE MAIN HALOS
AROUND VENUS AND THE SUN
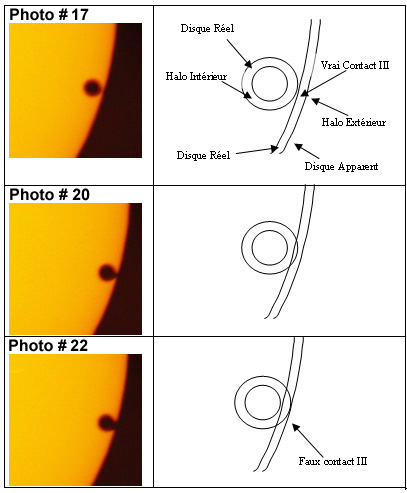
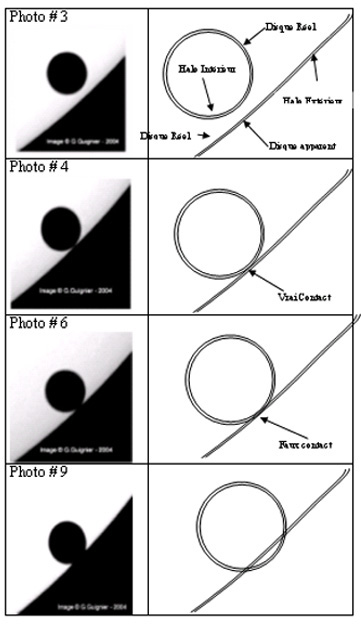
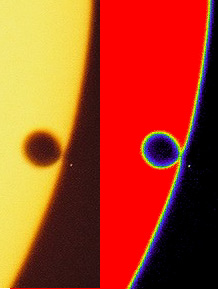
The untreated photographs taken by
A. Gendron and G. Guignier can be found on the Dorval Club Website. The untreated photographs # 17, 20 and 22 of
A. Gendron, and # 3, 4, 6 and 9 of G. Guignier are reproduced in Figure 1 - Figure 2
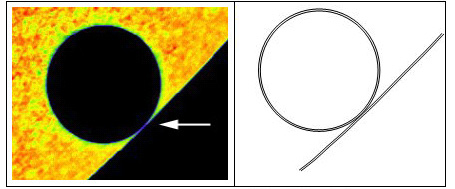
. A photograph taken from satellite TRACE, extracted from the Website www.transitofvenus.info (Pasachoff 2004)
with his permission, and colour-treated by G. St-Onge, is presented in Figure 3 .
In these photographs, halos can be observed around Venus and the Sun. These halos are represented by the drawings
of Figures 1-3, alongside the photos. These drawings are a schematic but accurate reproduction of the photographs.
The characteristic features of these halos are indicated in Table 2:
TABLE 2
The main halos around Venus and the Sun
|
Author
|
Telescope size,
in inches
|
Photo
|
True or false
colour of the halos
|
Width of the halos around Venus,
in arcseconds
|
|
A. Gendron
|
11
|
pellicule
|
red (true)
|
~ 7
|
|
G. Guignier
|
8
|
webcam
|
Grey (true)
|
~ 2
|
|
Satellite TRACE
|
12
|
CCD
|
blue (false)
|
< 1
|
It can be seen that the width of the halos corresponds very closely to the resolution of the 11-in and 8-in telescopes
deduced from MTF and PSF measurements in Table
1 ( ~ 8.2 and ~ 1.9
arcseconds, respectively). It thus appears reasonable to think that the observed halos are mainly due to the optical
resolution of the telescopes under the conditions used.
Even narrower halos are observed when using a telescope of very high optical resolution and a CCD camera located
outside Earth's atmosphere, therefore without any seeing effects (TRACE).
These halos occur at the interface between the intense light of the Sun and the very dark regions of Venus and
the sky. The first point to clarify was whether they are located above the bright disk of the Sun or above the
dark regions of Venus and the surrounding sky, or in-between.
The definitive demonstration of their location was obtained by measuring the diameter of Venus in the photographs,
with and without the halo, using the methods indicated in section 2. The internal diameter of the red halo of Venus
in the untreated photographs of A. Gendron (surrounding the internal black disk) was thus evaluated at ~ 43 arcseconds,
and the external diameter of the halo (internal black disk + the red halo) at ~ 57.6 arcseconds.
A similar calculation was performed by G. St-Onge for the untreated photographs of G. Guignier. The internal diameter
of the grey halo of Venus (surrounding the internal black disk) and its external diameter (internal black disk
+ the grey halo) were thus evaluated at ~ 55 arcseconds and ~ 58 arcseconds (100 pixels), respectively. He also
evaluated the external diameter of Venus in the photograph taken from TRACE at ~ 58 arcseconds for ~ 121 pixels
(in 8 bits format) and ~ 116 pixels (in FITS format).
Since the actual diameter of the disk of Venus on June 8, 2004, was 58.2 arcseconds, the halos of Venus in these
photographs are located within the real disk of Venus and not silhouetted against the Sun outside Venus'actual
disk. By extension, the same conclusion most probably applies to the halos around the disk of the Sun, which must
be located silhouetted against the dark surrounding sky, not on the real bright disk of the Sun.
As indicated previously, these halos are generated by the optical resolution of the telescopes used. They are characterized
by a loss of contrast (MTF) and a reduction in the tone of black at the interface between bright and dark regions.
The edges of Venus and of the Sun thus do not become dark immediately at the interfaces but only gradually.
In summary, the main halo of Venus in the untreated photographs is located within the real disk of Venus, and the
main halo of the Sun is located silhouetted against the sky. As indicated in the schematic drawings of Figure 1 - Figure 2 , it results that:
- the real disk of Venus in the untreated photographs is larger than its apparent (interior) black disk (more precisely,
it is the apparent black disk of Venus PLUS its internal halo).
- the real disk of the Sun in the untreated photographs is smaller than its apparent bright disk (more precisely,
it is the apparent disk of the Sun MINUS its external halo).
3.2. THE SECONDARY
HALOS AROUND VENUS AND THE SUN
As mentioned above, in the untreated photographs of A. Gendron, only one (red) halo is visible, which is located
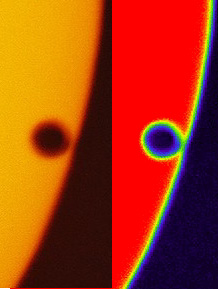
within the disk of Venus. After colour-treatment by G. St-Onge ( Figure 4 ), 3 halos of different colours (blue, green and yellow false colour) can be seen around
Venus. The diameters of these halos have been evaluated by A. Gendron. The external diameter of the green halo
is ~ 57.6 arcseconds and the internal diameter of the blue halo ~ 43 arcseconds. The blue-green halo therefore
corresponds to the red halo in the untreated photographs of Figure 1, and it is located within the real disk of
Venus. The external diameter of the yellow halo is about ~ 66 arcseconds. The yellow halo is therefore a secondary
halo located outside the real disk of Venus, silhouetted against the Sun, and not visible in the untreated photographs.
Three similar halos can be seen around the Sun in Figure 4 . By analogy with those around Venus, the blue-green
halo around the Sun is probably located silhouetted against the sky, while the yellow halo is a secondary halo
located within the disk of the Sun.
On the colour-treated photographs # 17 and # 18 of Figure 4 , at the contact point between Venus and the Sun, a
small deformation of the green-blue halos of Venus and the Sun can be seen, as if the halos were "attracted"
by one another.
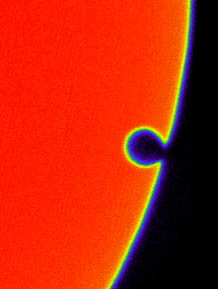
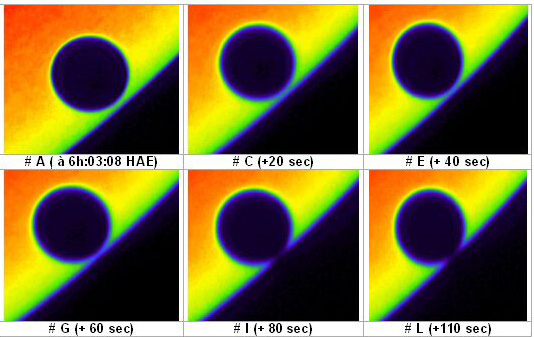
In the photographs of G. Guignier, submitted to a first colour-treatment by G. St-Onge ( Figure 5 ), a secondary halo, shown in green false colour, can also be seen around
Venus, with an external diameter of ~ 58 arcseconds. The external diameters of the blue halo and of the black disk
of Venus are ~ 55 and ~ 50 arcseconds, respectively. The actual disk of Venus therefore is located close to the
outer part of the green halo. By analogy, the actual disk of the Sun is probably smaller than the blue halo around
the Sun, and located in the first green halo around the Sun. This means that in photograph # E of Figure 5 , a
small part of the actual disk of Venus is already within the sky. In photographs C to G, a small deformation of
the blue halos of Venus and the Sun can be seen as in photographs # 17 and # 18 of Figure 4.
A second, more extensive image treatment of the photographs of G. Guignier has been applied by G. St-Onge With
that treatment, 4 different halos appear around Venus instead of 2, and 4 different halos around the Sun instead
of 1. The light intensities and widths of these supplementary halos are indicated in Table 3. Light intensities
are in arbitrary units on a scale of 256 to 0 (248 at the centre of the Sun; 200 for the Sun close to Venus but
far from the halos; 50 for the sky far from the Sun; 60 for the sky close to the halos; 58 for the internal black
disk of Venus far from the halos; 60 to 65 for the internal black disk of Venus close to the blue halo). Table
3 confirms further the great similarity between the (inverse) halos around Venus and around the Sun.
Note: it is to be noted that the number of halos depends on the way the computer assigns the colour table and the
narrowness of the division, and is not a real quantity.
TABLE 3
Supplementary halos around Venus and the Sun in the photographs by G. Guignier after a second, more extensive colour-treatment
by G. St-Onge
|
Halos
|
Around Venus
|
Around the Sun
|
|
False Colours
|
Intensity
|
~ Width
|
Intensity
|
~ Width
|
|
Blue
|
70-81
|
1.2
|
63-79
|
1.2
|
|
Green
|
89-104
|
1.2
|
86-114
|
1.2
|
|
Yellow
|
123
|
0.6
|
123-138
|
0.6
|
|
Red
|
147-177
|
1.2
|
>144
|
1.7
|
Width in arcseconds
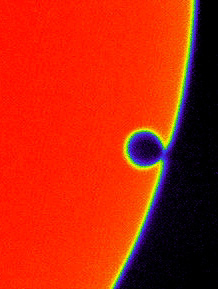
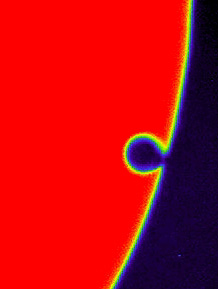
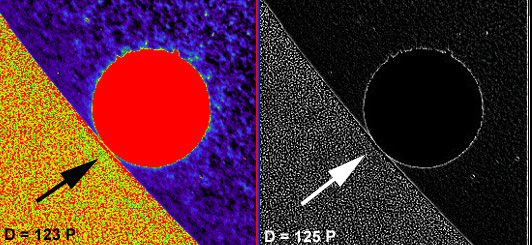
In the photograph by TRACE, colour-treated
by G. St-Onge ( Figure
6A ), the diameter
of the red internal disk of Venus is 121 pixels or ~ 58 arcseconds and therefore corresponds to the real disk of
Venus. The external diameter of the yellow/green halo in Figure 6A (around the red disk of Venus) is 122.5 pixels
or ~ 59 arcseconds, and therefore it is located outside the real disk of Venus. Its intensity is between 59 and
179 (on a scale of 200 for the Sun and 0 for the sky).
In the photograph treated for edge detection by Pasachoff and Schneider ( Figure 6B ), the external and internal diameters of the white edge circle of Venus
are 124 and 122 pixels, respectively, meaning that it is outside the yellow halo of Venus of Figure 6A.
3.3. THE BLACK DROP
FORMATION
The formation of a "black drop" is quite obvious in the untreated photographs (Figures 1 - 2 ) and colour-treated photographs (Figures 4 - 5 ) of A. Gendron and G. Guignier. Taking into account the actual location of the halos
in Figures 1-2 and 4-5, the black drop appears to start forming when the main apparent halo of Venus has contacted
the main halo of the Sun, which corresponds to the contact between the real disk of Venus and the real disk of
the Sun (" real " contact III, as indicated in the schematic drawings of Figures 1-2).
Note: in the colour-treated photographs # 17 and # 18 of A. Gendron in Figure 4 , a deformation of the blue-green
halos appears to form around real contact III. A similar deformation of the blue halos also occurs in the colour-treated
photographs # C to G of G. Guignier in Figure 5 .
A more precise examination of the
photographs in Figure 5 indicates that the real contact III corresponds approximately to photograph # C, and that
the deformations of the halos start forming just after real contact III. This is confirmed by the deformation of
the light isophotes measured by G. St-Onge in these photographs.
A very faint "bridging" or "black drop" effect thus appears in the photographs as soon as real
contact III is reached and these deformations start forming. Visually, the black drop effect becomes more visible
a bit later (20 to 30 seconds later) in the photographs and in the telescopes on-site.
The black drop is more obvious and easier to observe in all photographs when the real disk of Venus comes in contact
with the apparent disk the Sun, and beyond (the apparent disk of the Sun is the bright disk plus its main halo
in contact with the "black" sky). But these are "false" contacts III, the real contact having
already been crossed, and the black drop effect having already started. The black drop being easier to observe
at these false contacts III, this may explain why it is often mistakenly mentioned that the black drop forms BEFORE
(apparent) contact III. Actually, it forms AFTER real contact III.
The black drop is also easier to observe when the halos are larger (for instance, in Figure 1 than in Figure 2 ). With instruments of very high resolution and low diffraction, such as those aboard
satellite TRACE (Figure 3A
and 6A ), a darkening (shown in blue or yellow false
colour), or bridging of the region between Venus and the Sun can be observed, which may also be interpreted as
a faint black drop effect. This darkening appears to be related to the interaction of the darker halos around Venus
and the Sun.
3.4. PROPOSED EXPLANATION FOR
THE BLACK DROP EFFECT
From the above observations, the following tentative explanation can be proposed for the black drop effect observed
visually or on untreated photographs:
When the real disk of Venus comes in contact with the real disk of the Sun (real contact III), the two halos around
Venus and the Sun also come in contact. At this point, there is a loss of contrast between the two halos, which
cannot be distinguished from one another anymore. This results in the formation of an apparent darker bridge between
Venus and the sky. The limb darkening of the Sun probably participates to this bridging effect, especially in the
high resolution images.
Then, when the real disk of Venus starts crossing the real disk of the Sun, the external halo of the Sun and the
internal halo of Venus around the contact point are partially then totally eliminated.
The external halo of the Sun disappears because the real disk of the Sun is not anymore in direct contact (interface)
with the sky. And the internal halo of Venus disappears because this part of the real disk of Venus is not anymore
above the real disk of the Sun but above the sky.
These parts of the halos of Venus and the Sun having disappeared around the contact point, the underlying part
of the real disk of Venus becomes very black again, giving a strong impression of a black drop.
4. CONCLUSIONS
Several observers in Montreal have visually seen the black drop effect during the transit of Venus. The photographs
taken confirm these observations and indicate that the "black drop" results from the contact then the
disappearance of the halos that appear as artefacts in the scanning of Venus and the Sun. The black drop therefore
is not merely an illusion of visual perception but essentially a part of the real disk of Venus (as identified
by its actual diameter of 58 arcseconds in the photographs).
REFERENCES
Dantowitz, R., Sky and Telescope, October 2004, 141
Dorval Amateur Astronomy Club, astrosurf.com//stog/saisons_ciel/
Koren, M., normankoren.com/Tutorials/MTF5.html
Observer's Handbook for the Year 2004
Pasachoff, J. M., Schneider, G., nicmosis.as.arizona.edu:8000/eclipse_ web/ transit_04/trace/tov_trace.html
Pasachoff, J. M., La Recherche, 385 (April 2005), 42-43.
Royal Swedish Academy of Sciences, vt-2004.kva.astro.su.se/
Schneider, G., Pasachoff, J. M., and Golub, L., 2004, "Space Observations of the 15 November 1999 Transit
of Mercury and the Black Drop Effect for the 2004 Transit of Venus," Icarus 168 (April), 249-256.
Seip, S., antwerp.gsfc.nasa.gov/apod/ap040611.html
Westfall,J., Sky and Telescope, November 2004, 78.
ACKNOWLEDGEMENTS
Mr.J. M. Pasachoff is deeply thanked for his valuable comments and suggestions for improving this paper.
ANNEX A
The following phenomena, which might have interfered with the interpretation of the main halos and the black drop
effect, have been examined and eliminated:
A1: LOSS OF LUMINOSITY
OF THE SUN'S LIMB:
In Figures 1, 2 and 5, it can be seen that the limb of the Sun becomes progressively darker towards the edge
of the Sun, an effect known as "limb darkening." This loss of luminosity is related to the lower temperature
of gases in the upper layers of the Sun's photosphere ( T~4500 ) as compared to the lower layers (T~5800 ).
Starting from 10,000 at the centre of the Sun, the loss of luminosity along the limb is progressive (from 9000
to 3000 in relative intensity), and widely spread (over more than 1.5 times the diameter of Venus or 100 arcseconds
in Figures 1,2,5). By comparison, the halos around the Sun are located at the extreme exterior edge of the Sun,
they are narrow (1.5 to 7 arcseconds), corresponding to the resolution of the telescopes and are of more uniform
luminosity. Therefore, it seems unlikely that the halos around the Sun in Figures 1,2,5 are due only to the limb
darkening. They are more likely related to the optical resolution of the amateur telescopes used here, as indicated
in section 3.1. Limb darkening, however, probably contributes more significantly to the halos in very high resolution
telescopes, as indicated by Schneider, Pasachoff and Golub, who have shown that in the images of TRACE the falloff
at the extreme edge of the Sun is so rapid that the limb darkening does, in fact, contribute to the black drop
effect.
A2: THE ATMOSPHERE
OF VENUS:
High resolution photographs taken by the Swedish Solar Telescope on La Palma, Canary Islands, Spain, of the Royal
Swedish Academy of Sciences of Sweden in 2004 show the atmosphere of Venus when the planet exits the disk of the
Sun. From these photographs, the thickness of the atmosphere of Venus has been calculated as 0.4 arcseconds, which
is consistent with the dimension reported elsewhere (Westfall 2004) of ~ 60 km or 0.3 arcseconds. The atmosphere
of Venus therefore is smaller than the halos around Venus and cannot interfere with the interpretation of the halos
of Venus (this was also ruled out by Schneider, Pasachoff and Golub in the images by TRACE).
A3. THE CHROMOSPHERE
OF THE SUN:
Photographs taken during the transit of Venus with an hydrogen filter (at 653.3 nm, therefore in visible light)
are available (Dantowitz 2004, Serp 2004). No halos can be seen in these photographs, while the chromosphere of
the Sun is clearly visible, allowing to evaluate its thickness as 4 to 8 arcseconds. In the photographs by G. Guinier
and TRACE, the chromosphere is therefore larger than the observed halos (~ 1 to ~ 2 arcseconds), but since it cannot
be seen at all in these photographs taken in visible light, it most probably does not interfere with the interpretation
of the halos and the black drop (Note: the limb darkening is different and the brightness difference between the
Sun and the sky is much lower in H-alpha.)
|